Umbrella Grafana – crossing Zabbix and Microsoft SCOM
Let’s show, using our test bench as an example, how to cross Zabbix and SCOM in a single Grafana and do service monitoring (from the point of view of the health of services). Details and screenshots under the cut.
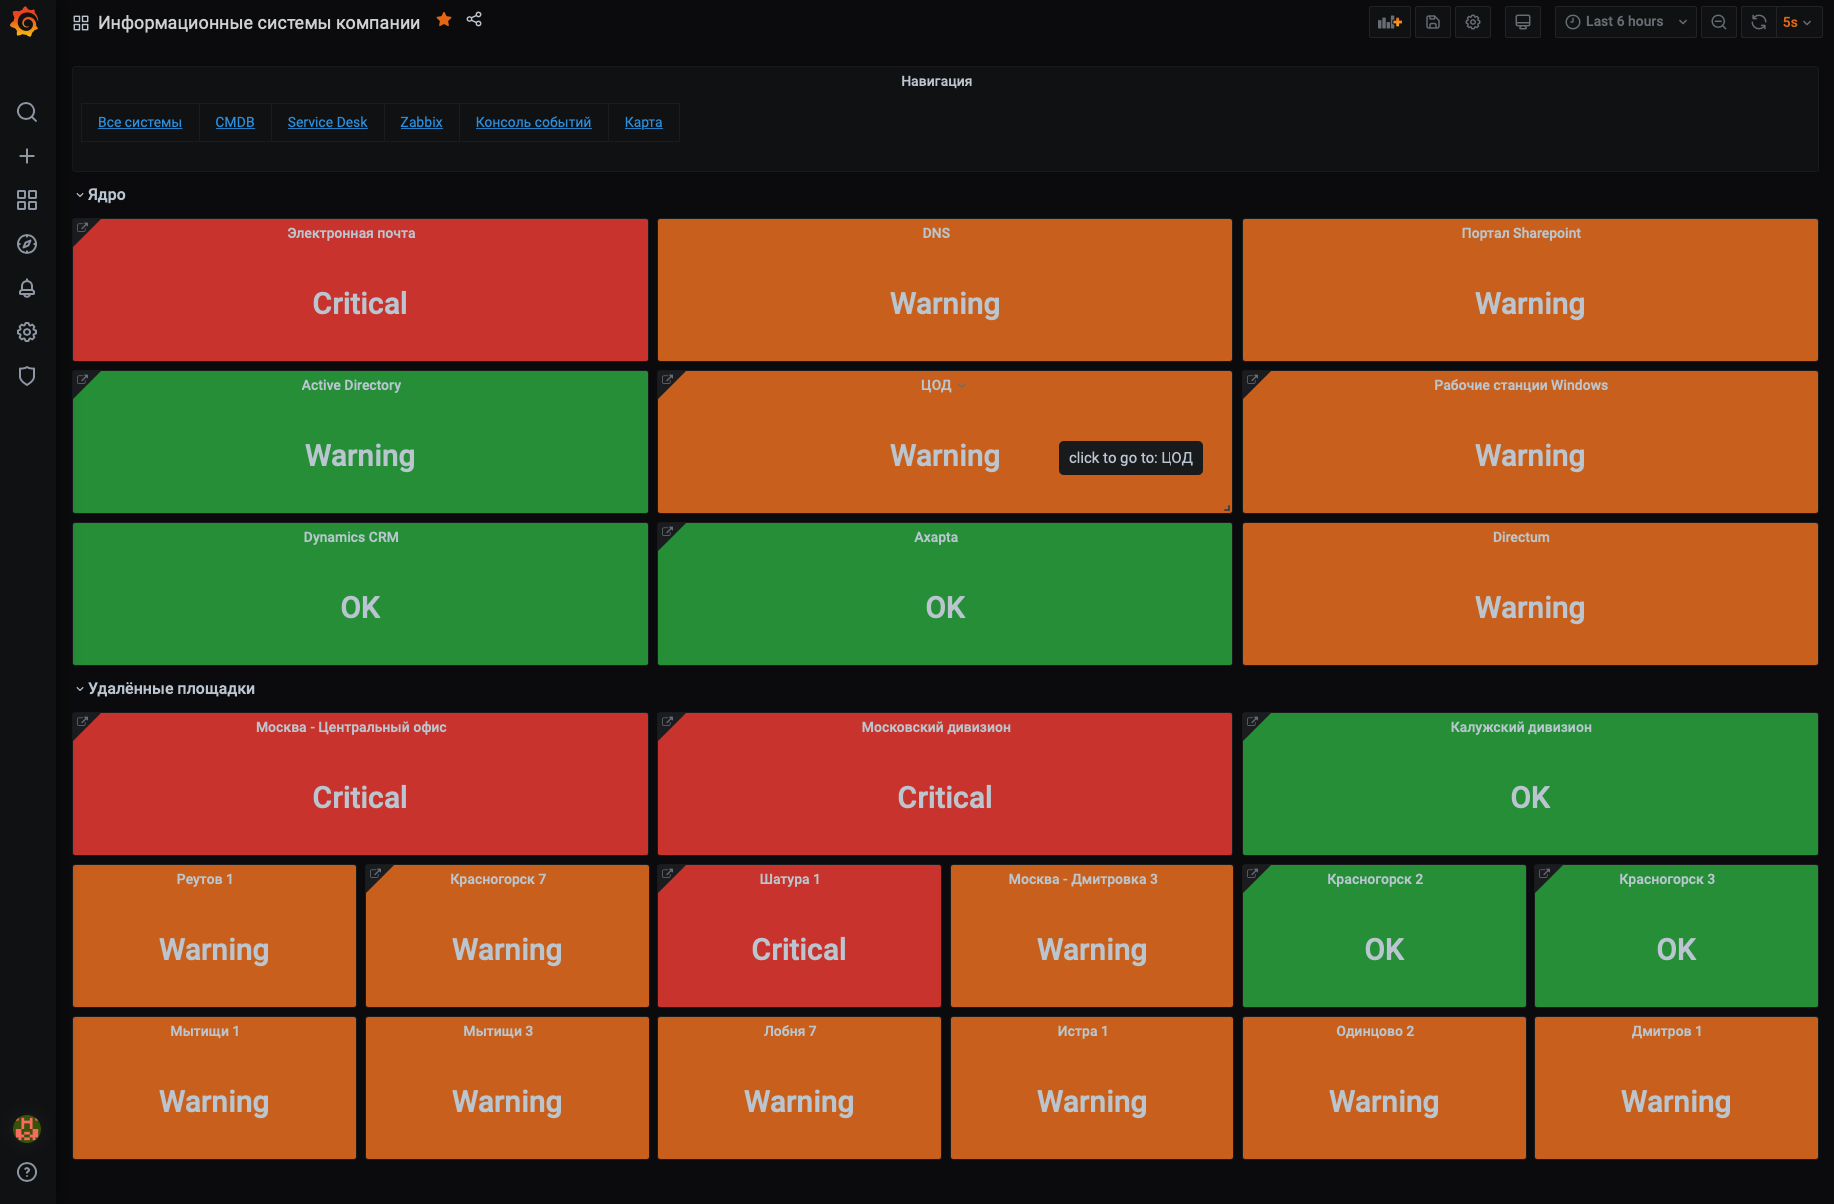
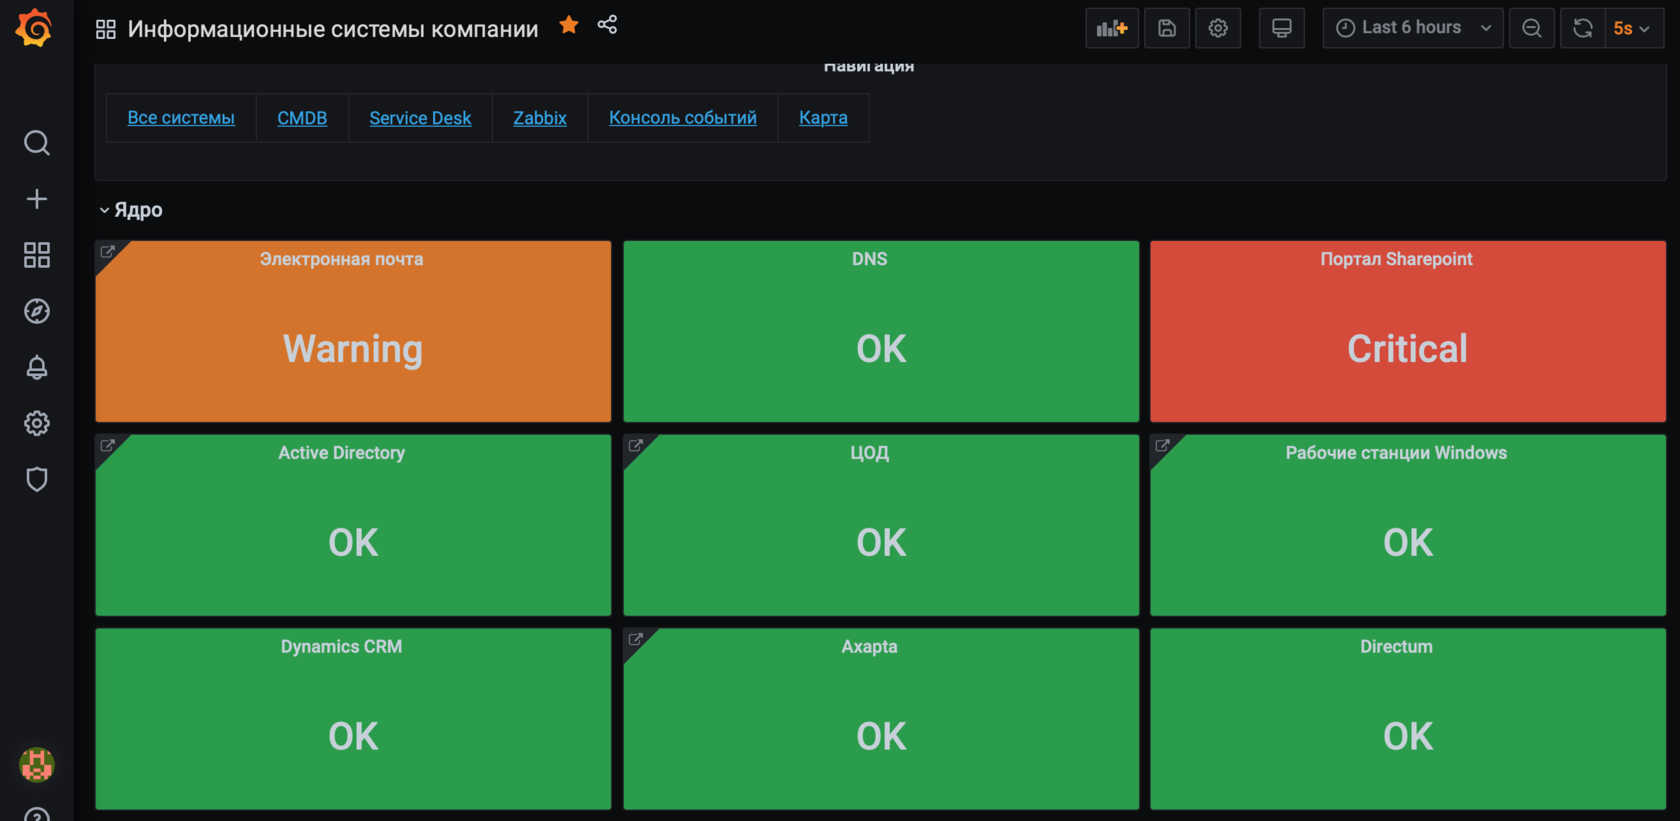
The screenshot below shows the company’s information systems. Here is email, DNS, Active Directory, Sharepoint and others. Each square is the aggregated status of the information system. Below we will show how this happens. Please note that different systems can be covered by different monitoring systems. In our case, these are Zabbix and SCOM.
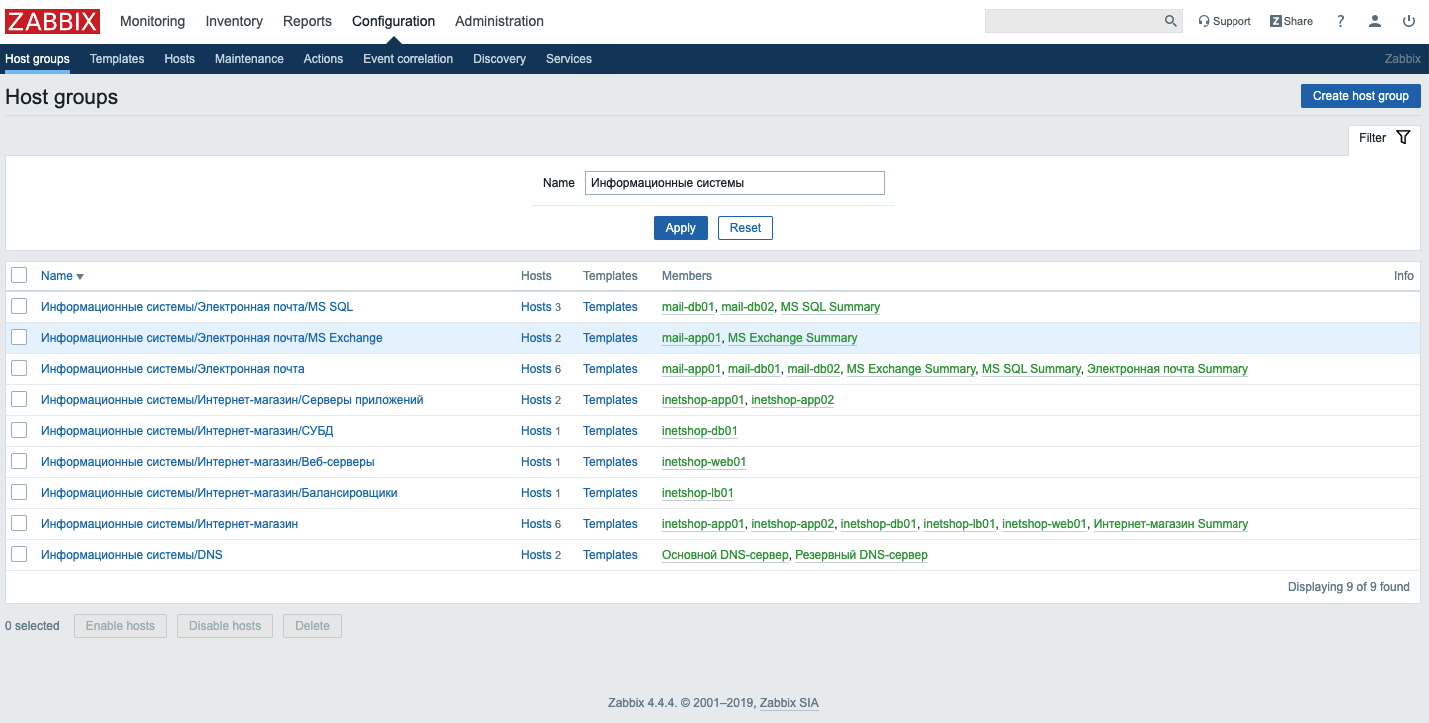
Let’s start with Zabbix. There it is possible to create groups of nodes. Each node has a corresponding set of triggers. What do we do next? We look for the worst trigger status on the node and send its value to a special data item. Next, we carry out a similar action to aggregate the worst trigger status for a group of nodes and get the aggregated health status of the group.
After that, you can bind status items to tiles in Grafana. The screenshot below shows the components of the E-mail information system. Each tile is an aggregated health status of the system’s services. Each tile is a link, you can fail and see on which node the problem is. Please note that this aggregation allows you to display nested events at each level (they are under the tiles).
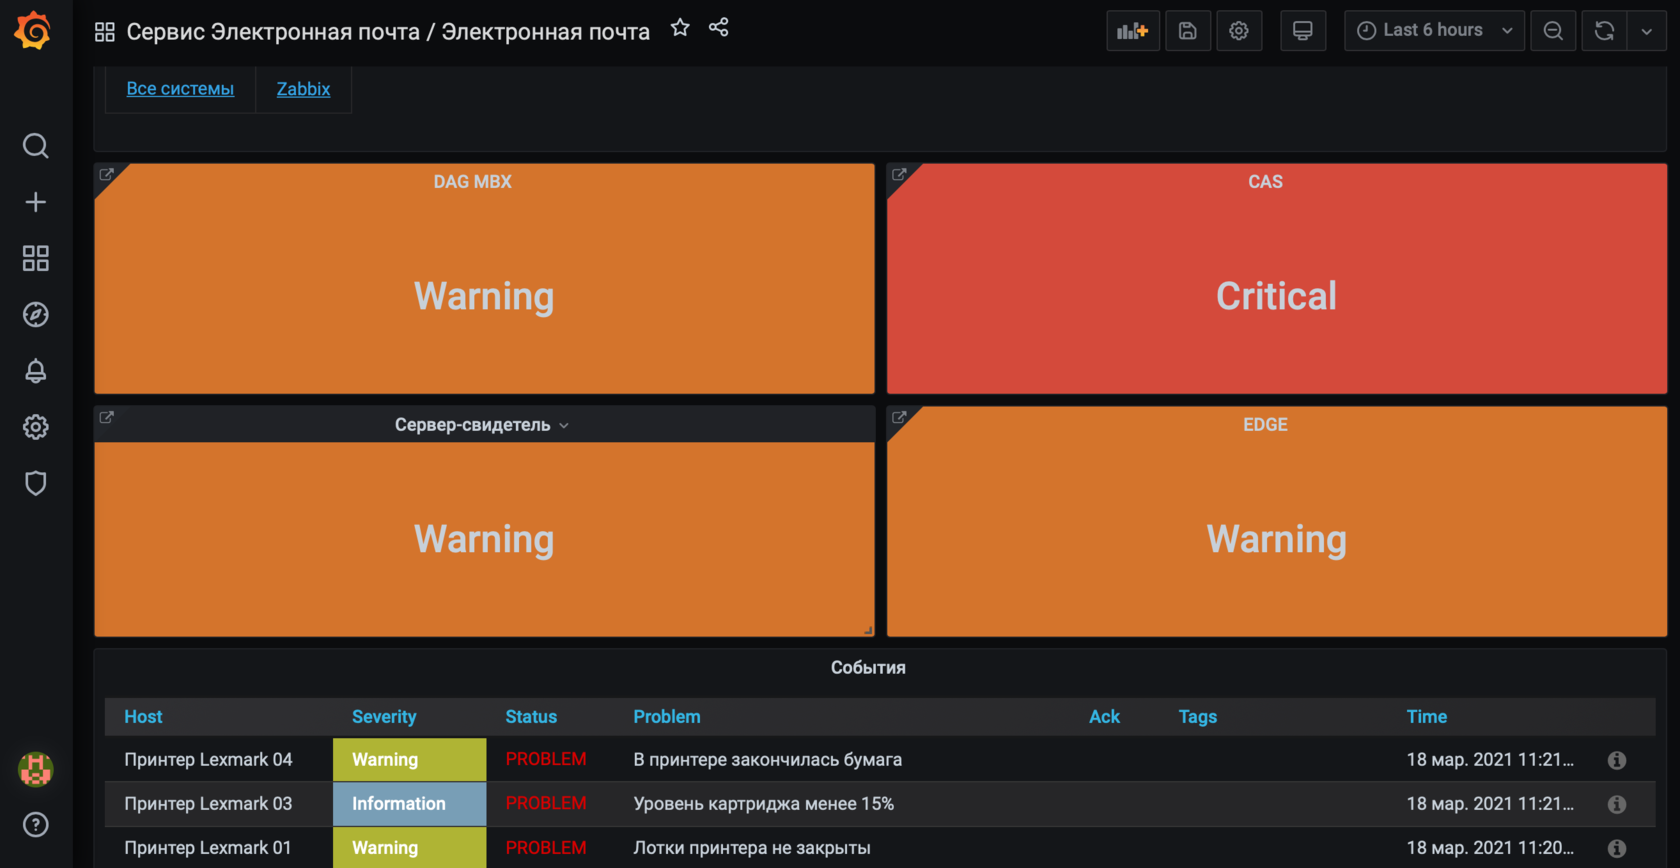
If you fall further, you can reach the level of the node, where its performance metrics will be. If desired, there you can make a tile with aggregated virtualization statuses, and then network devices. The approach depends on the tasks. With Zabbix sorted out, let’s move on to SCOM.
The integration of Grafana with SCOM is implemented using SQL queries to the OperationsManager and OperationsManagerDW databases. The first is for short-term storage, the second is for long-term storage. Using an SQL query, we get a list of nodes that are monitored in SCOM.
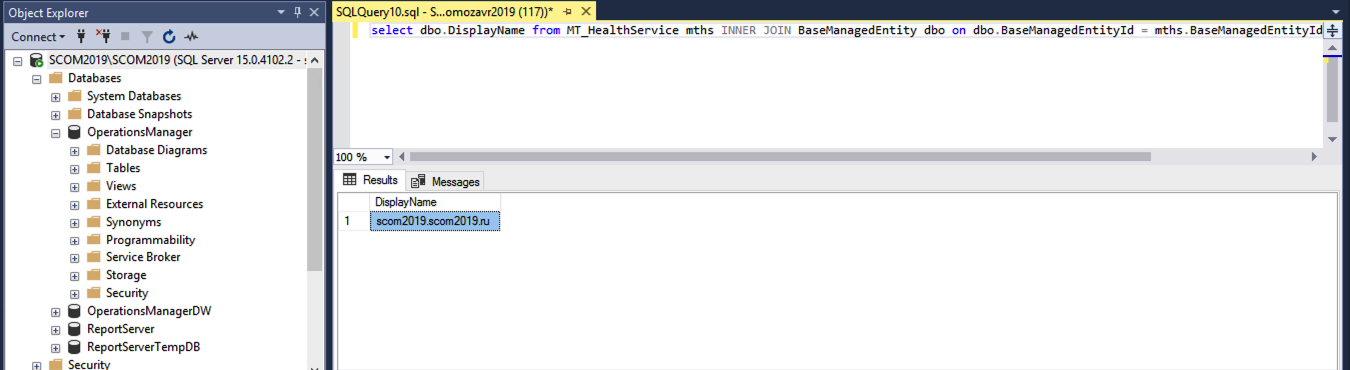
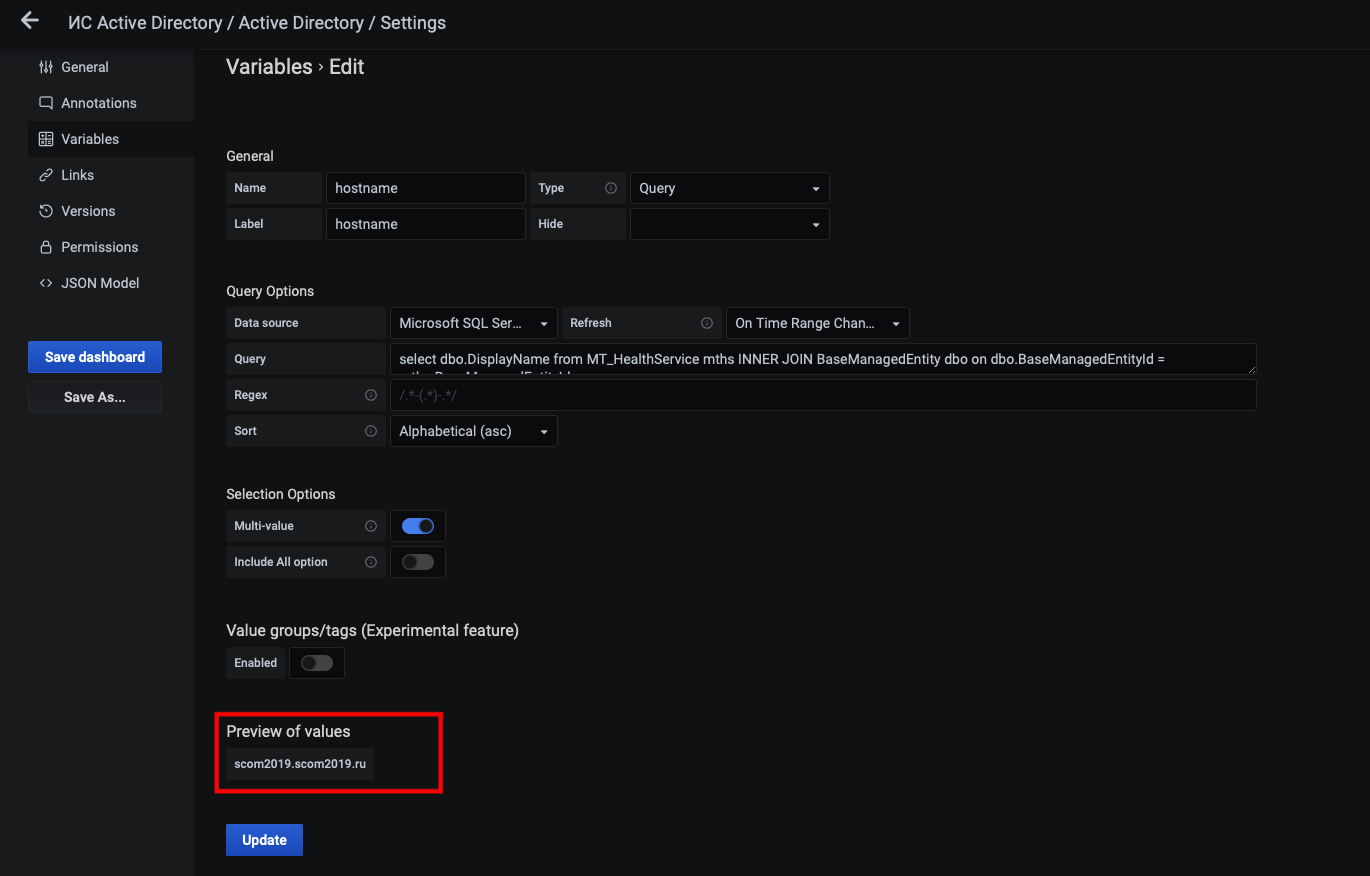
Let’s set up variables that will define filters in Grafana and help to automate the appearance of new nodes here in the future.
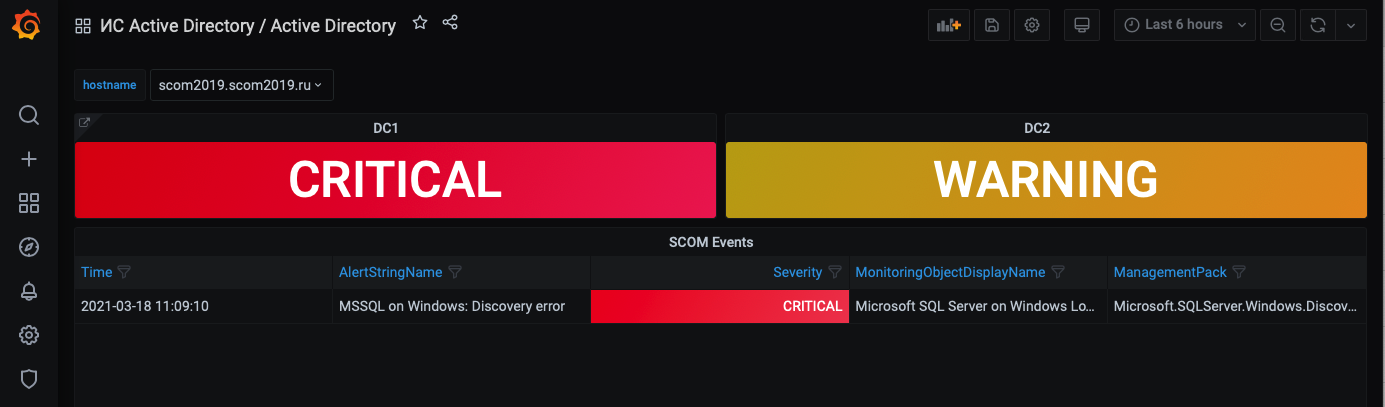
Other SQL queries in SCOM can get node statuses (similar to Zabbix) and a list of events. Thus, by clicking on the Active Directory tile at the information systems level, you can go to the view from domain controllers and the corresponding events for them.
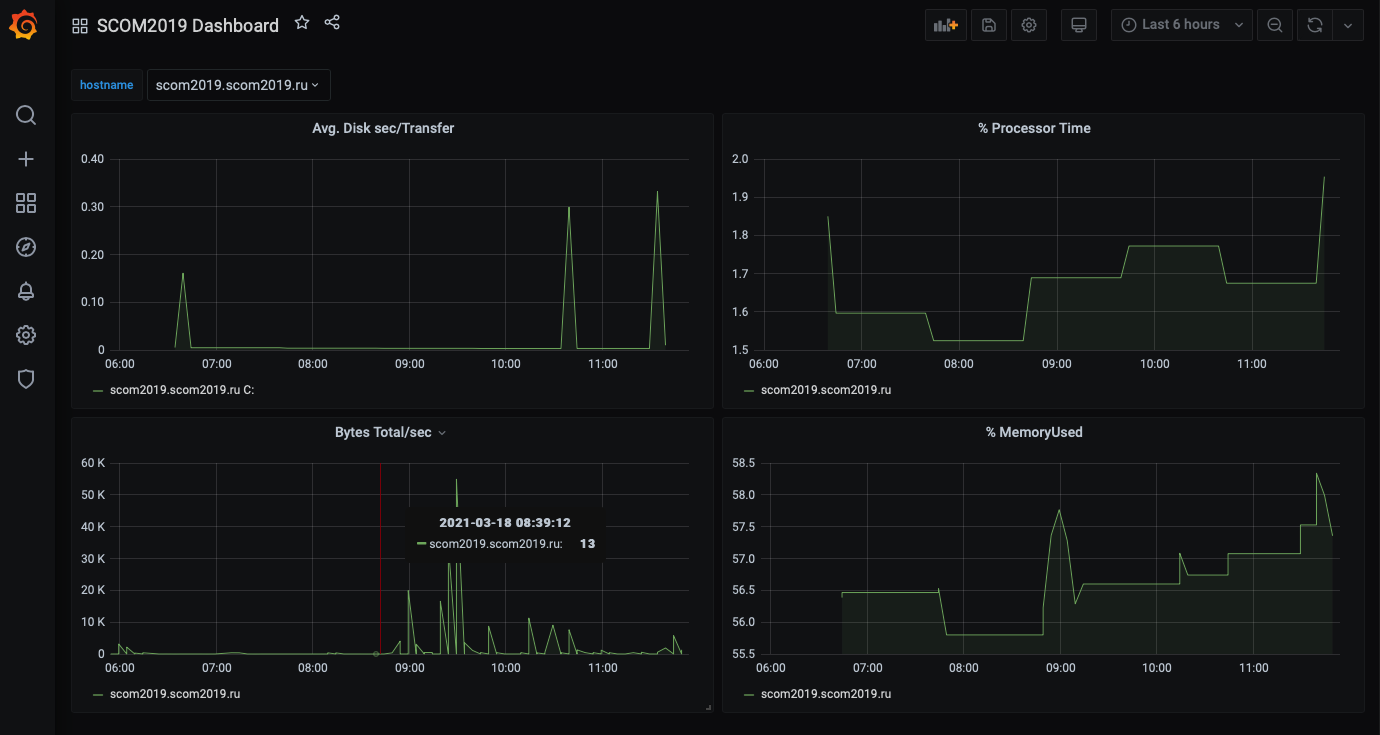
Well, then look at the values of individual node metrics.
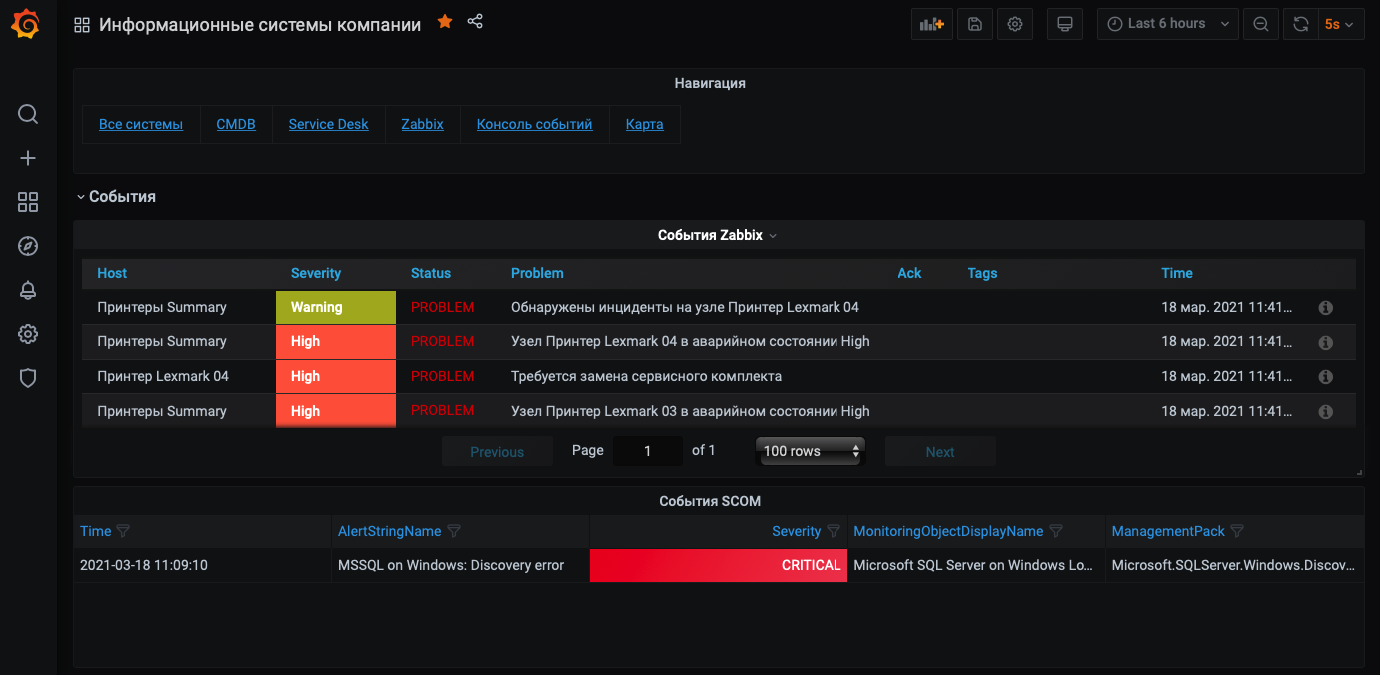
You can also use this view with events simultaneously for Zabbix and Microsoft SCOM.
Thanks for attention! Hope it was interesting.
We also have:
Description of a comprehensive solution for monitoring on open systems
Zabbix under lock and key: enable security options for Zabbix components for access from inside and outside
Add CMDB and geographic map to Zabbix
If you are interested in Zabbix implementation, administration and support services, you can leave a request at feedback form on our website.