Tracing in Go is easy
In the era of fast-growing services, it is important to be able to monitor the state of the system at any time. One of the tools to achieve this are logs and metrics that help us keep track of many parameters such as requests per second (RPS), memory consumption, percentage of calls cached and so on. In other words, logs and metrics add to our system such an important characteristic as observability (observability)
observability allows us to easily fix bugs and solve new problems by answering the question “Why is this happening?“.
Imagine that after months of work, the average response time of the service has increased by 2 times, which we learned from the metrics. You can immediately assume that the problem is on the database side, but in complex projects with a large number of integrated technologies, the reason is no longer so obvious. What if several parts of our service started to slow down? In such situations, the total query execution time does not indicate to us either the problem area or the direction where we need to dig. Another tool comes to the rescue called tracing (tracing).
In this article, we will look at the basics of integrating tracing into applications written in Go language with the help of tools opentelemetry and Jaeger. Most of it is taken from the official documentation, so you can always explore this topic in more detail.
opentelemetry
opentelemetry (OTel) is a standard for collecting data on the operation of applications, which consists of ideas from already existing implementations, such as OpenCensus and OpenTracing. The main task is to provide a set of standardized SDKs, APIs and tools for preparing and sending data to services (back-end observability) to monitor systems.
OTel includes libraries for many popular languages (C++, Java, Python, .NET, PHP, Rust full list), as well as ready-made community tools for tracing popular libraries and frameworks. Before we start writing code, I suggest that you familiarize yourself with the main components in OpenTelemetry that we will use in the future. The first important component of OpenTelemetry is span.
Span
Span is a unit of work (execution) of some operation. It keeps track of specific events (events) that the request is performing, painting a picture of what happened during the time during which this operation was performed. It contains a name, time data, structured messages, and other metadata (attributes) to provide information about the monitored operation.
An example of the information that the http request span contains:

They are divided into two types: Parent (root) span and child span. Child spans are created by nested function calls that are inherited from a previously created parent span. In the implementation for the Go language, they are passed via context.Context.
The rule is simple: if there is already a span in the passed context, then we create a child from it. Otherwise, we create the parent (root) span.
Each span has span_id and trace_id. It is important to know that from the beginning of the creation of the parent span to the end of the child spans trace_id does not changewhile span_id for each span unique. Such properties allow nesting and branching of multiple calls to be combined:
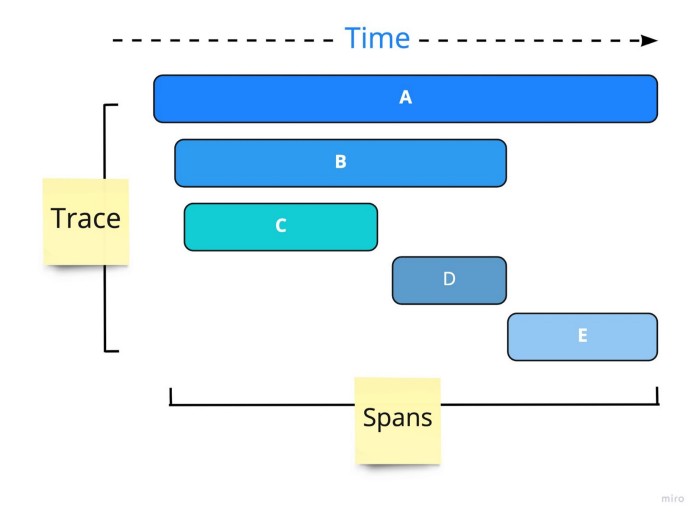
For example, in a microservice architecture, we can pass trace_id between services to get the complete call tree at the end. Similarly, by sending the same identifier from the client, you can get data on all its calls for analytics (and not only).

A status can have one of two statuses: error and Ok . As the name suggests, status error indicates that an error occurred during the execution of operations, and Ok vice versa – all operations were completed successfully
Jaeger
Earlier it was said that OpenTelemetry only prepares (does not store!) and sends data to back-end observability. One example of such a backend is Jaeger.
At the time of writing, the latest version is 1.41.0. Learn more about installation in documentation
Installation
Docker
docker run -d --name jaeger \
  -p 16686:16686 \
  -p 14268:14268 \
  jaegertracing/all-in-one:1.41
docker-compose
version: '3.8'

services:
  jaeger:
    image: jaegertracing/all-in-one
    ports:
      - "14268:14268"
      - "16686:16686"
docker compose up -dLocal installation
Download and run the finished binary https://www.jaegertracing.io/download/
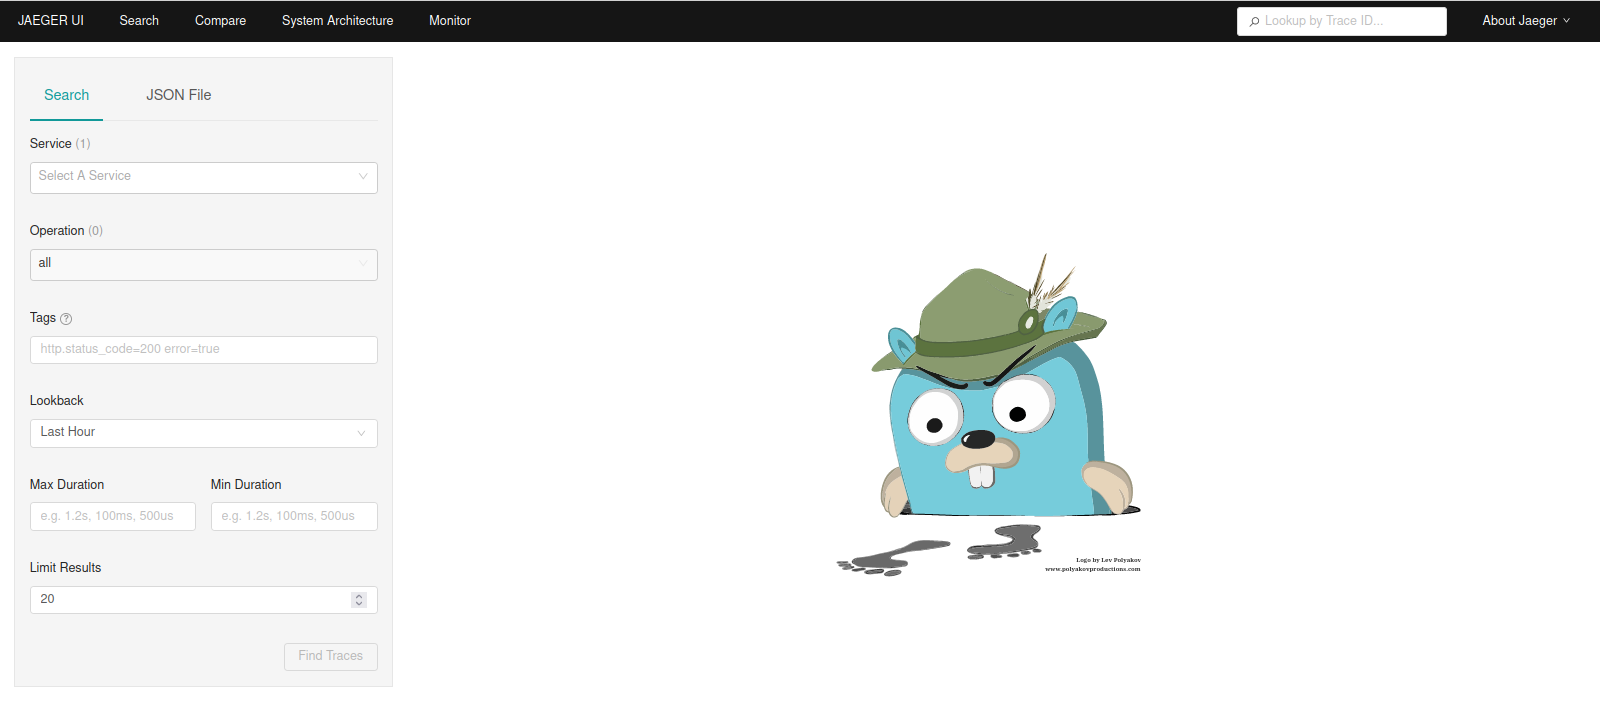
When opening http://localhost:16686 you should see something like this:
Writing an application
For example, I wrote a small service that will save and return notes from Redis.
Structure:
Structure
├── storage
│   └── redis.go
├── server
│   └── http.go
├── models
│   └── note.go
├── main.go
├── go.sum
├── go.mod
├── docker-compose.yaml
└── cmd
    └── main.go
models/note.go
package models

import (
	"errors"
	"time"
)
import "github.com/google/uuid"

var ErrNotFound = errors.New("note not found")

type Note struct {
	NoteID  uuid.UUID `json:"note_id"`
	Title   string    `json:"title"`
	Content string    `json:"content"`
	Created time.Time `json:"created"`
}
storage/redis.go
package storage
import (
"context"
"encoding/json"
"fmt"
"github.com/go-redis/redis/v9"
"github.com/google/uuid"
"trace-example/models"
)
type NotesStorage struct {
client redis.UniversalClient
}
func NewNotesStorage(client redis.UniversalClient) NotesStorage {
return NotesStorage{client: client}
}
func (s NotesStorage) Store(ctx context.Context, note models.Note) error {
data, err := json.Marshal(note)
if err != nil {
return fmt.Errorf("marshal note: %w", err)
}
if err = s.client.Set(ctx, note.NoteID.String(), data, -1).Err(); err != nil {
return fmt.Errorf("redis set: %w", err)
}
return nil
}
func (s NotesStorage) Get(ctx context.Context, noteID uuid.UUID) (*models.Note, error) {
data, err := s.client.Get(ctx, noteID.String()).Bytes()
if err != nil {
if err == redis.Nil {
return nil, models.ErrNotFound
}
return nil, fmt.Errorf("redis get: %w", err)
}
var note models.Note
if err = json.Unmarshal(data, ¬e); err != nil {
return nil, fmt.Errorf("unmarshal note: %w", err)
}
return ¬e, nil
}
server/http.go
package server

import (
	"errors"
	"github.com/gofiber/fiber/v2"
	"github.com/google/uuid"
	"time"
	"trace-example/models"
	"trace-example/storage"
)

type FiberHandler struct {
	notesStorage storage.NotesStorage
}

func NewFiberHandler(notesStorage storage.NotesStorage) FiberHandler {
	return FiberHandler{notesStorage: notesStorage}
}

func (h FiberHandler) CreateNote(fiberctx *fiber.Ctx) error {
	input := struct {
		Title   string `json:"title"`
		Content string `json:"content"`
	}{}

	if err := fiberctx.BodyParser(&input); err != nil {
		return err
	}

	noteID := uuid.New()
	err := h.notesStorage.Store(fiberctx.UserContext(), models.Note{
		NoteID:  noteID,
		Title:   input.Title,
		Content: input.Content,
		Created: time.Now(),
	})
	if err != nil {
		return fiber.NewError(fiber.StatusInternalServerError, err.Error())
	}

	return fiberctx.JSON(map[string]any{
		"note_id": noteID,
	})
}

func (h FiberHandler) GetNote(fiberctx *fiber.Ctx) error {
	noteID, err := uuid.Parse(fiberctx.Query("note_id"))
	if err != nil {
		return fiber.NewError(fiber.StatusBadRequest, err.Error())
	}

	note, err := h.notesStorage.Get(fiberctx.UserContext(), noteID)
	if err != nil {
		if errors.Is(err, models.ErrNotFound) {
			return fiber.NewError(fiber.StatusNotFound, err.Error())
		}
		return fiber.NewError(fiber.StatusInternalServerError, err.Error())
	}

	return fiberctx.JSON(note)
}
cmd/main.go
package main

import (
	"context"
	"github.com/go-redis/redis/v9"
	"github.com/gofiber/fiber/v2"
	"log"
	"trace-example/server"
	"trace-example/storage"
)

func main() {
	app := fiber.New()

	// Подключаемся к Redis
	client := redis.NewClient(&redis.Options{
		Addr: "localhost:6379",
	})
	if err := client.Ping(context.TODO()).Err(); err != nil {
		log.Fatal("create redis client", err)
	}

	// Настраиваем роутер
	handler := server.NewFiberHandler(storage.NewNotesStorage(client))
	app.Post("/create", handler.CreateNote)
	app.Get("/get", handler.GetNote)

	log.Fatal(app.Listen(":8080"))
}
docker-compose.yaml
version: '3.8'

services:

  jaeger:
    image: jaegertracing/all-in-one
    ports:
      - "14268:14268"
      - "16686:16686"


  redis:
    restart: on-failure

    image: "redis:latest"

    command: redis-server --port 6380

    ports:
      - "6379:6379"

    environment:
      REDIS_REPLICATION_MODE: master

    volumes:
      - redis-data:/var/lib/redis

volumes:
  redis-data:
Raise containers with Redis and Jaeger
docker compose up -dAnd we start our service
go run cmd/main.goAfter the start, we can add a note:

And get it back:

curl requests
Adding a note
curl --location --request POST 'localhost:8080/create' \
--header 'Content-Type: application/json' \
--data-raw '{
    "title":"Something interesting",
    "content": "Lorem ipsum..."
}'
Getting a note
curl --location --request GET 'localhost:8080/get?note_id=7411ff79-fd1d-46ab-b9f8-21105cd770ce'Let’s start integrating OpenTelemetry by creating exporter which sends (exports) data to back-end observability and has a simple interface
type SpanExporter interface {
    ExportSpans(ctx context.Context, spans []ReadOnlySpan) error
    Shutdown(ctx context.Context) error
}
Here we see another type of spans – ReadOnlySpan. This is not a separate type, but just an interface for getting information about the span.
Now let’s create exporter for Jaeger:
package tracer

import (
	"go.opentelemetry.io/otel/exporters/jaeger"
	tracesdk "go.opentelemetry.io/otel/sdk/trace"
)

// NewJaegerExporter creates new jaeger exporter
//
//	url example - http://localhost:14268/api/traces
func NewJaegerExporter(url string) (tracesdk.SpanExporter, error) {
	return jaeger.New(jaeger.WithCollectorEndpoint(jaeger.WithEndpoint(url)))
}
Now let’s create provider (provider), which will create tracers
package tracer

import (
	"go.opentelemetry.io/otel/exporters/jaeger"
	"go.opentelemetry.io/otel/sdk/resource"
	tracesdk "go.opentelemetry.io/otel/sdk/trace"
	semconv "go.opentelemetry.io/otel/semconv/v1.12.0"
)

func NewTraceProvider(exp tracesdk.SpanExporter, ServiceName string) (*tracesdk.TracerProvider, error) {
	// Ensure default SDK resources and the required service name are set.
	r, err := resource.Merge(
		resource.Default(),
		resource.NewWithAttributes(
			semconv.SchemaURL,
			semconv.ServiceNameKey.String(ServiceName),
		),
	)
	if err != nil {
		return nil, err
	}

	return tracesdk.NewTracerProvider(
		tracesdk.WithBatcher(exp),
		tracesdk.WithResource(r),
	), nil
}
Let’s analyze the code:
return tracesdk.NewTracerProvider(
		tracesdk.WithBatcher(exp),
		tracesdk.WithResource(r),
), nil
When creating a provider, we add options:
With Batcher – sends data to the exporter in batches, increasing performance
WithResource – adds data (resources) to each trace
resource.Merge(
	resource.Default(),
	resource.NewWithAttributes(
		semconv.SchemaURL,
		semconv.ServiceNameKey.String(ServiceName),
	),
)
resource.Merge combines multiple resources. Together with the standard ones, we add the version of the library and the name of the service to add the ability to filter the traces of each service.
Now it remains only to create a tracer:
package tracer

import (
	"fmt"
	"go.opentelemetry.io/otel"
	"go.opentelemetry.io/otel/exporters/jaeger"
	"go.opentelemetry.io/otel/sdk/resource"
	tracesdk "go.opentelemetry.io/otel/sdk/trace"
	semconv "go.opentelemetry.io/otel/semconv/v1.12.0"
	"go.opentelemetry.io/otel/trace"
)

func InitTracer(jaegerURL string, serviceName string) (trace.Tracer, error) {
	exporter, err := NewJaegerExporter(jaegerURL)
	if err != nil {
		return nil, fmt.Errorf("initialize exporter: %w", err)
	}

	tp, err := NewTraceProvider(exporter, serviceName)
	if err != nil {
		return nil, fmt.Errorf("initialize provider: %w", err)
	}

	otel.SetTracerProvider(tp) // !!!!!!!!!!!

	return tp.Tracer("main tracer"), nil
}
otel.SetTracerProvider(tp) is a very important line. It defines a global provider so that other instrumented libraries can start their traces.
Add a call to main.go InitTracer :
func main() {
tracer, err := trace.InitTracer("http://localhost:14268/api/traces", "Note Service")
if err != nil {
	log.Fatal("init tracer", err)
}
........
We are looking for ready-made tools:
Before you write your bike, try to find it ready on the Internet
In total, there are three ways to search for ready-made tools
View in https://github.com/open-telemetry/opentelemetry-go-contrib/tree/main/instrumentation
Find the package in the repository of the required library
otelXxx(Xxx is the name of the library)To Google 🙂
golang название_библиотеки OpenTelemetry
For example, let’s find a toolkit for github.com/gofiber/fiber:

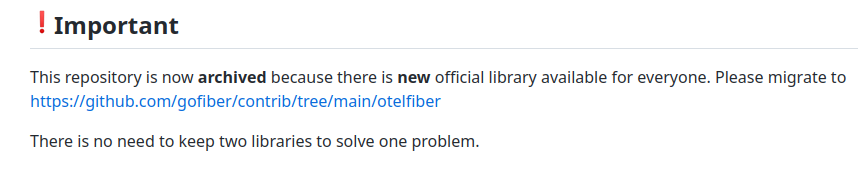
We see that the third-party repository is archived, but its code has been added to official
Many libraries do not have readme.md file, so it’s always best to look in example folder. Finding a string app.Use(otelfiber.Middleware("my-server")) . Let’s add it to our code!
import "github.com/gofiber/contrib/otelfiber"

func main() {
    _, err := trace.InitTracer("http://localhost:14268/api/traces", "Note Service")
    .......
	app := fiber.New()
	app.Use(otelfiber.Middleware("my-server")) // <-------
    .......
After the restart, we will execute a few queries and return to Jaeger:


After clicking on Find Traces, we will see a list of our traces:
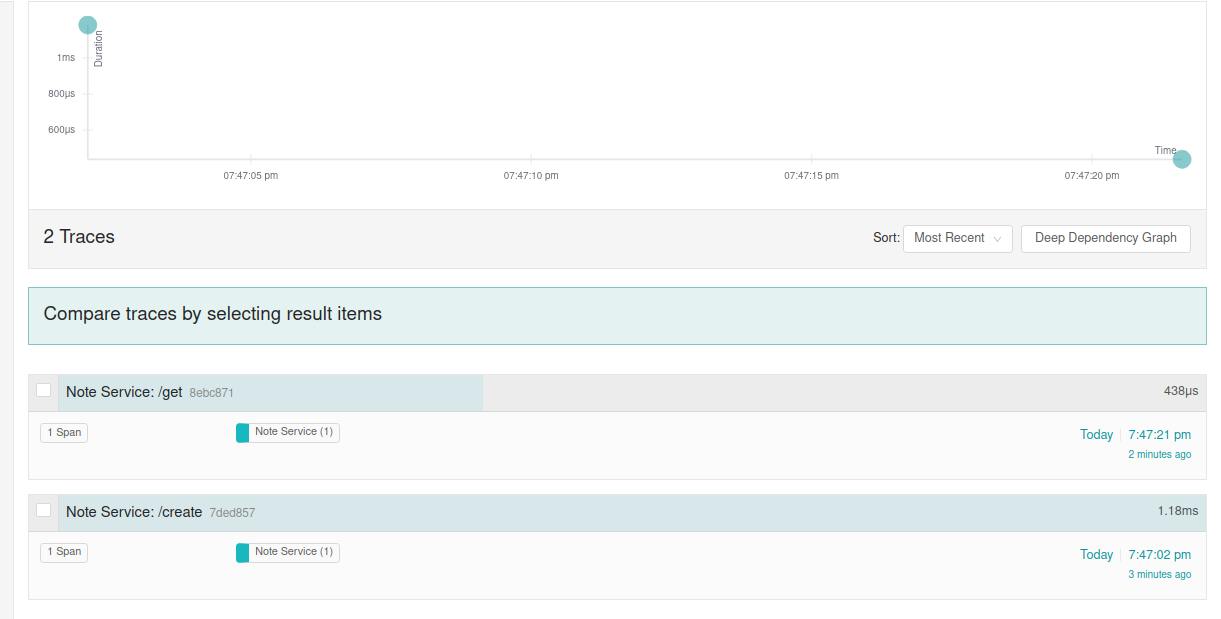
To go to the trace we need, just click on its name.
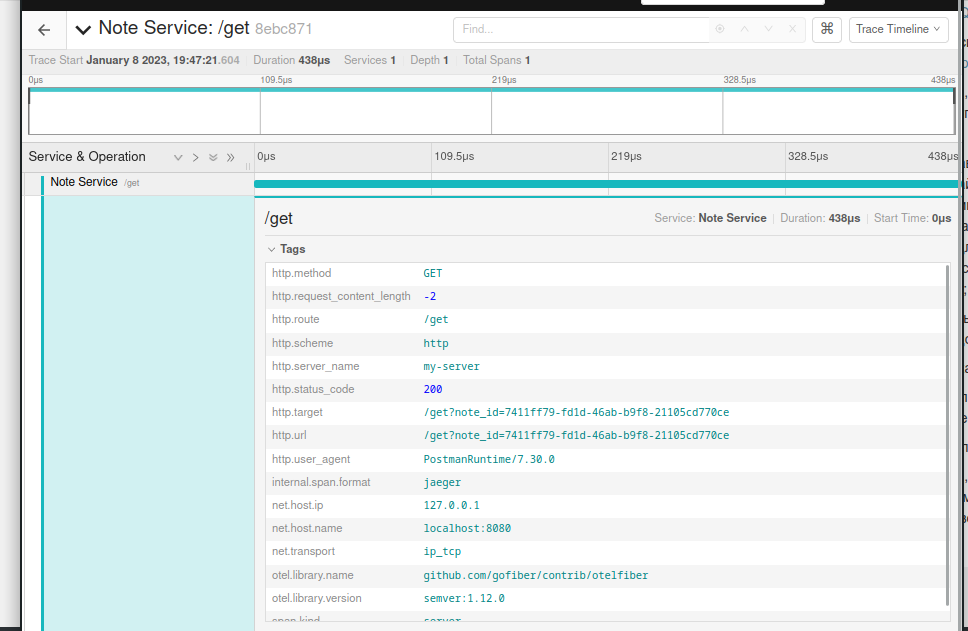
How it works?
Earlier, we created a middleware for the fiber framework that intercepts an incoming request, creates a parent span, and passes it in the context. Note that without the line otel.SetTracerProvider this trace will not be recorded anywhere.
In the span’s metadata, he included request and response data that might be important when fixing problems.
Now let’s add tracing for radish: using the second search method, we will find out that the required package is already in the repository go-redis – https://github.com/go-redis/redis/tree/master/extra/redisotel. Let’s add it to the code:
import "github.com/go-redis/redis/extra/redisotel/v9"

func main() {
    .........
	// Подключаемся к Redis
	client := redis.NewClient(&redis.Options{
		Addr: "localhost:6379",
	})
	if err := client.Ping(context.TODO()).Err(); err != nil {
		log.Fatal("create redis client", err)
	}
	if err := redisotel.InstrumentTracing(client); err != nil { // <------
		log.Fatal("enable instrument tracing", err)
	}
    .........
Let’s run the queries again and look at the traces. Don’t forget to press the button Find Traces again (or reload the page)
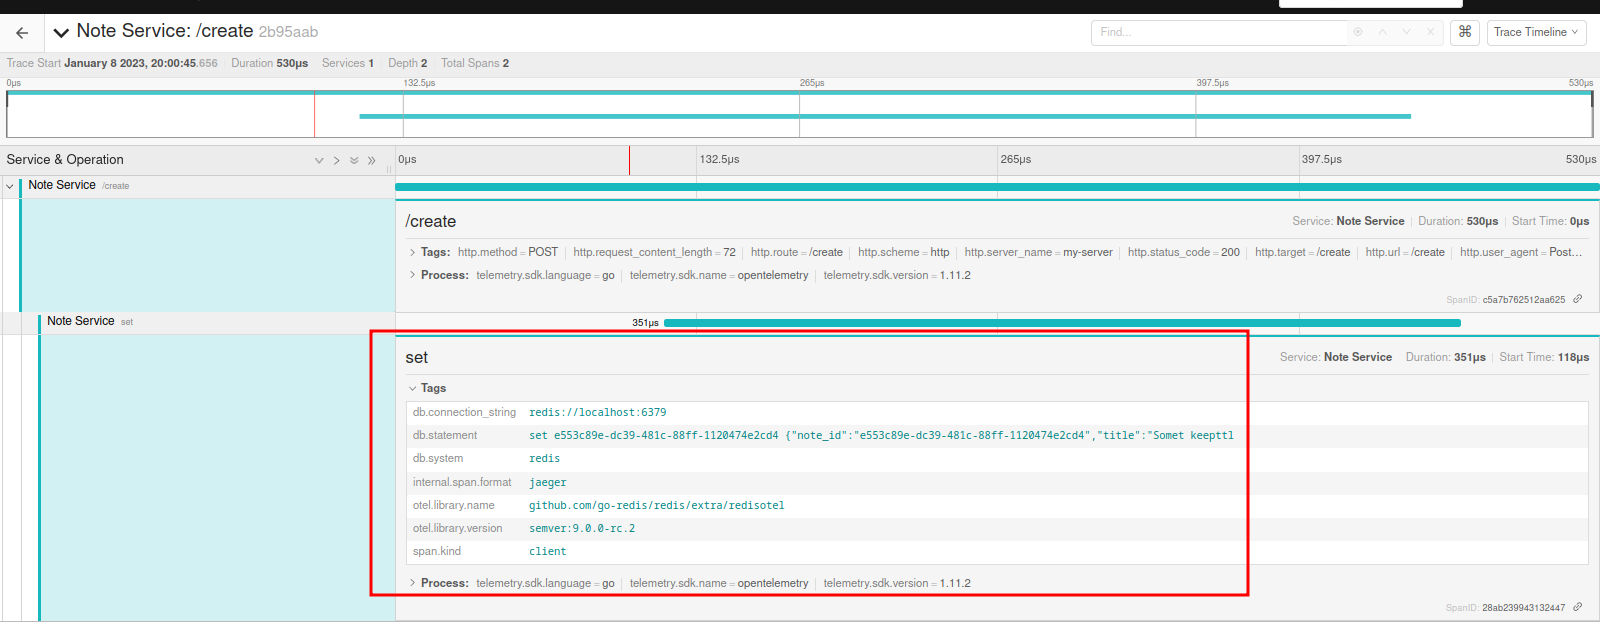
Now we can see not only fiber data, but also queries in the database!
How it works?
redisotel adds a hook for our client to create another span with the required data when calling any operation.
In our example, we only looked at two libraries, but you can find several hundred for popular libraries. Examples:
otelgrpc – unary interceptor for gRPC requests
otelmongo – tracer for mongodb client
hotelhttp – net/http middleware
hotelsarama – tracer for sarama, a popular kafka client
oteliber, otelgin, otelbeego, otelecho – middleware for web frameworks
hotelmemcached – tracer for memcached client
otelkit – tracer for microservice framework kit
otelgocql – tracer for Cassandra client
And many others!
Manual tracing
It would seem that with such tools we are already increasing the observability our service. But often there are situations when you need to create your own spans with more detailed information. Let’s take a look at the tracer interface:
type Tracer interface {
    Start(ctx context.Context, spanName string, opts ...SpanStartOption) (context.Context, Span)
}
Let’s add it to the structure FiberHandlers
type FiberHandler struct {
	notesStorage storage.NotesStorage
	tracer       trace.Tracer // <-------
}

func NewFiberHandler(notesStorage storage.NotesStorage, tracer trace.Tracer) FiberHandler {
	return FiberHandler{notesStorage: notesStorage, tracer: tracer}
}
Now let’s create our span:
ctx, span := h.tracer.Start(fiberctx.UserContext(), "GetNote")
defer span.End()
....
note, err := h.notesStorage.Get(ctx, noteID)
....
Important points:
In all subsequent functions, you need to pass the context obtained from
tracer.Startdefer span.End()ends the span. Span time = call timespan.End()– call timetracer.Start()
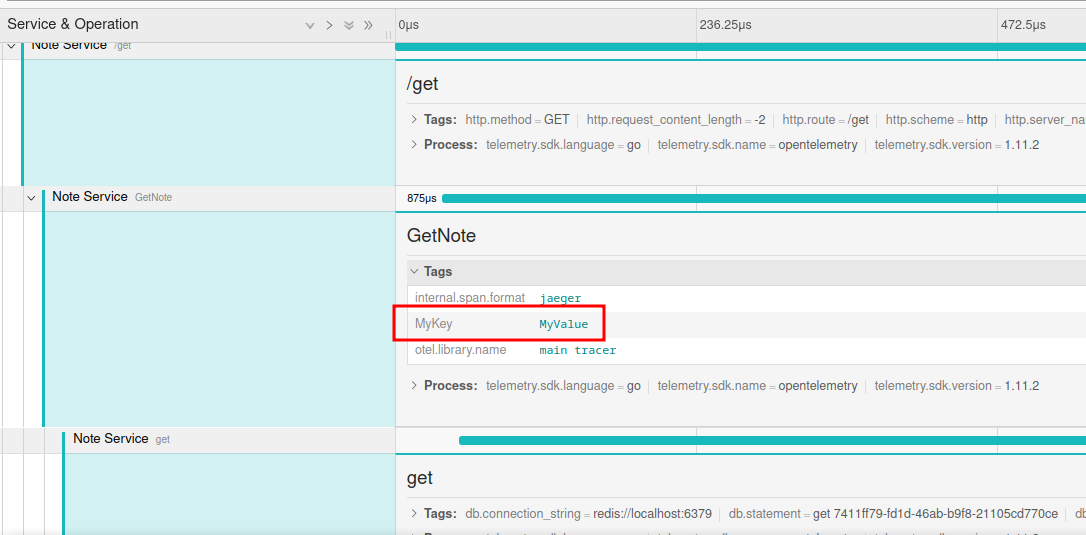
To add your information to the span, you need to use the function trace.WithAttributes()
ctx, span := h.tracer.Start(fiberctx.UserContext(), "GetNote", trace.WithAttributes(
	attribute.String("MyKey", "MyValue")),
)
Now let’s look at the new trace:
Events:
Often our functions make multiple calls to others. To measure the time of each, it is possible to divide the span into events using span.AddEvent(). You can also set attributes in the parameters:
func (h FiberHandler) GetNote(fiberctx *fiber.Ctx) error {
	ctx, span := h.tracer.Start(fiberctx.UserContext(), "GetNote")
	defer span.End()

	span.AddEvent("parse note_id") // <------
	noteID, err := uuid.Parse(fiberctx.Query("note_id"))
	if err != nil {
		return fiber.NewError(fiber.StatusBadRequest, err.Error())
	}

	span.AddEvent("call redis storage", trace.WithAttributes( // <----

		attribute.String("MyEventKey", "MyEventValue")),
	)
	note, err := h.notesStorage.Get(ctx, noteID)
	if err != nil {
		if errors.Is(err, models.ErrNotFound) {
			return fiber.NewError(fiber.StatusNotFound, err.Error())
		}
		return fiber.NewError(fiber.StatusInternalServerError, err.Error())
	}

	span.AddEvent("write note in json") // <------
	return fiberctx.JSON(note)
}
If we open the details of the new span, we will see the following
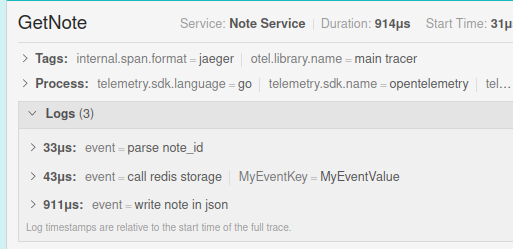
The numbers here are not execution time, but the amount of time elapsed since the beginning of the span (in other words, offset). For example, real query execution time in redis = sleep time – previous shift = 914 – 43 = 871 microseconds.
Spawn states and errors
Stop Redis and try to execute the query:
$ docker ps --format '{{.ID}} {{.Names}}'
3d69134be67f trace-example-redis-1
830c81a3b071 trace-example-jaeger-1
$ docker stop 3d69134be67f
3d69134be67f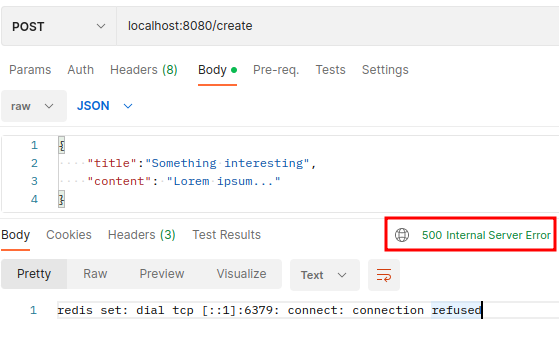

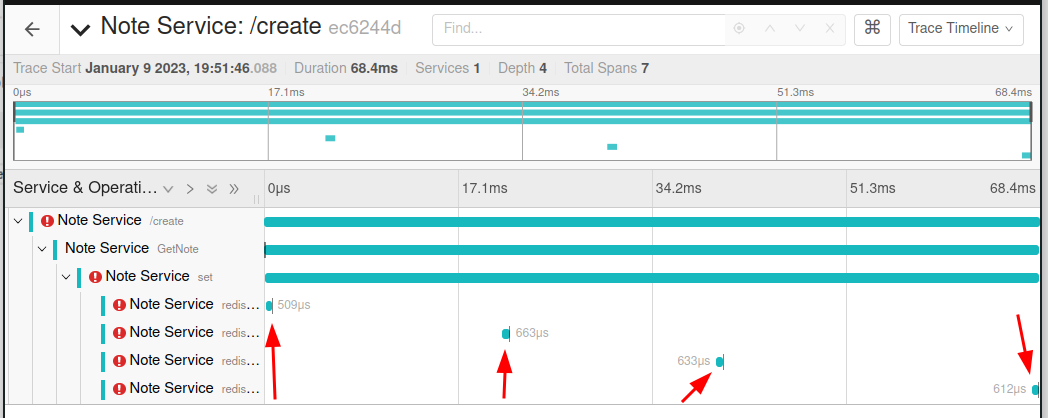
From the trace, you can understand that the radish client tried to restore the connection 4 times, but returned an error at the end. We can see the details in the parent span:
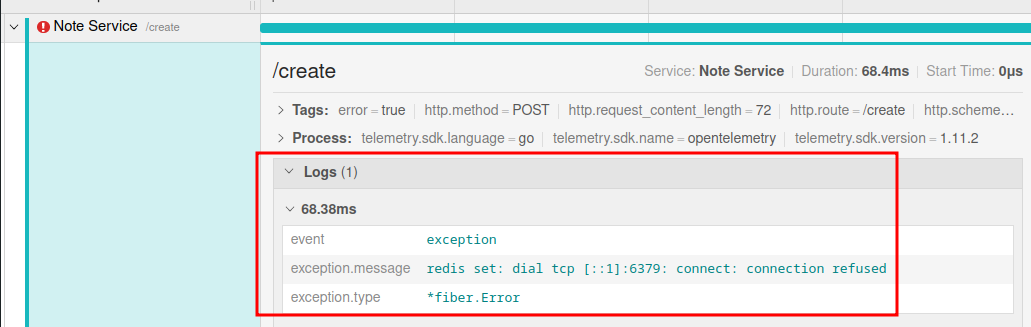
But why do we see the type *fiber.Error? Previously connected middleware from otelfiber checks for an error in our handler. If err != nil, then it writes the error to the span using the method span.RecordError(err) . Let’s add this line to our code:
import "go.opentelemetry.io/otel/codes"
....
    err := h.notesStorage.Store(ctx, ......)
	if err != nil {
		span.RecordError(err)
		span.SetStatus(codes.Error, err.Error())

		return fiber.NewError(fiber.StatusInternalServerError, err.Error())
	}
....
Pay attention to the extra challenge span.SetStatus . From the RecordError description:
An additional call to SetStatus is required if the Status of the Span should be set to Error, as this method does not change the Span status
Earlier it was said that a span has one of two statuses: Ok and Error . In the code above, we additionally set this status (although Jeager considers the trace with an error even without it).
You can also add attributes to the error record, as in the span and its events:
span.RecordError(err, trace.WithAttributes(
    attribute.String("SomeErrorInfo", "FATAL!!!!")),
)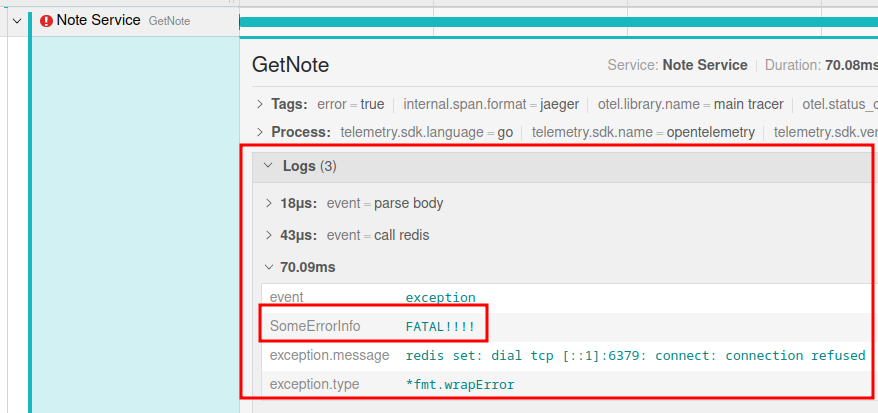
Now the error will be recorded not only through the toolkit, but also in our code. If you raise all errors to the top, then call span.RecordError only possible at the transport or service level. Otherwise (if errors are logged in place), adding an entry at each stage can be useful.
Conclusion
The code: https://github.com/illiafox/tracing-example
In this article I wanted to show that a terrible word tracing – only half an hour of reading the documentation. By adding just a few lines to the clients of the products used, we can easily track any execution with the smallest details, and with manual spans, in general, find out all the necessary information without getting into the code.
A lot of information was taken from the official documentation:
In the next article, we will look at tracing between microservices, which (spoiler) is also implemented in one line.