Top 20 strongest IT brands of employers in Russia and how we found them: summing up the research
Hello! In August, Habr and Ekopsi began researching employers’ IT brands for their “weight” among IT specialists. The questionnaires have been processed, the data has been analyzed – and we are ready to share the results. Last time we talked about the respondents of our study (or his “passport”), and now, in fact, to the results. About who eventually entered the Top 20, and most importantly, how we determined it – under the cut.
Let’s start with the main thing: the first place in the rating is occupied by JetBrains, and the Top 20 strongest IT brands are as follows:
| A place | Company | The power of the IT brand | Appreciated | Who chose the best or the worst |
| 1 | JetBrains | 98.4% | 868 | 330 |
| 2 | Cisco | 97.3% | 788 | 141 |
| 3 | Red Hat | 94.4% | 1682 | 189 |
| 4 | Hewlett Packard Enterprise | 92.8% | 1511 | 91 |
| five | DataArt | 91.7% | 836 | 201 |
| 6 | Wrike | 90.5% | 874 | 188 |
| 7 | Avito | 90.2% | 1630 | 348 |
| eight | Positive Technologies | 90.0% | 619 | 51 |
| nine | Badoo | 89.9% | 889 | 140 |
| ten | ABBYY | 89.7% | 1631 | 161 |
| eleven | Wargaming | 86.5% | 876 | 95 |
| 12 | Kaspersky Lab | 86.4% | 2793 | 596 |
| 13 | SEMrush | 85.5% | 623 | 71 |
| fourteen | Yandex | 85.0% | 2107 | 1207 |
| fifteen | Samsung | 84.4% | 1460 | 105 |
| sixteen | SAP | 84.2% | 1675 | 248 |
| 17 | HeadHunter | 82.9% | 1856 | 130 |
| 18 | T-Systems | 81.9% | 1085 | 116 |
| nineteen | Deutsche Bank | 81.5% | 1338 | 107 |
| 20 | Okko | 80.6% | 792 | 52 |
How we calculated the coefficients in the table and what is the “strength of the IT brand”
“The strength of the IT brand” is an indicator of the attractiveness of an employer for a potential job seeker. To understand the logic of its calculation, let us recall the stages of the IT brand funnel (above) from the point of view of a candidate in the labor market, how he navigates through offers and chooses a job for himself. Let’s take a closer look:
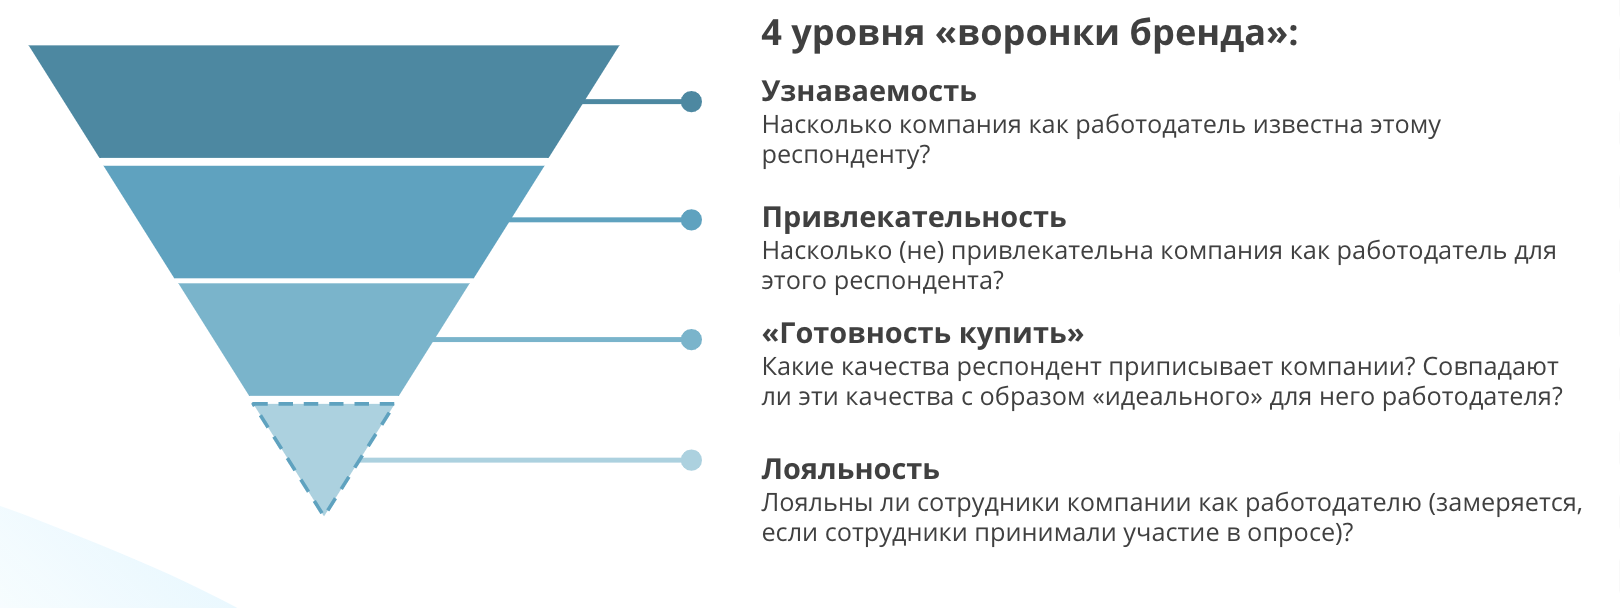
Recognition – “I know something about this company, in general I understand what it does, and I can imagine what kind of work it can offer me.”
Spoiler alert: high recognition (especially among companies from the b2c sector) does not guarantee high lines in the final rating.
Attractiveness – “I have an opinion whether this company is a good employer, whether I am ready to consider it one of the best employers, or, on the contrary, I consider it one of the worst employers.”
Spoiler alert: the attractiveness of almost all well-known companies decreases due to the emergence of pronounced “opponents” – those who choose it as “the worst employer” (it may well be due to negative experience of interaction with a product or service).
“Willingness to buy” – “I understand very well what conditions this company offers me, what qualities work in this company has and whether the characteristics of this company coincide with what I expect from the employer”.
Spoiler alert: even if a survey participant named a company as the “Best Employer”, it is not a fact that he will be able to give it specific characteristics. Not all companies have clear and regular communication with their potential candidates about their conditions, characteristics and culture. Therefore, it turns out like this – “I seem to like the company, but I don’t know why.”
Loyalty – “I am an employee of the company and I am ready to recommend it to my friends and acquaintances as the best employer.”
Spoiler alert: we did not take this measurement into account in the overall rating, but we were surprised at how sometimes the assessments of those who are “in the house” and those who assess the company “outside” differ. As if we are talking about different organizations!
So…
What we did to measure the strength of the IT brand
4723 respondents took part in the study (they completely “walked through the funnel” and evaluated the companies at all three stages) – in detail about those who participated in the survey, wrote here (thank you all again!). We also included almost 500 companies in the survey that we wanted to evaluate as employers.
Of course, we did not ask everyone who took the survey about all 500. Instead, we asked the respondents to indicate in which professional areas out of 11 proposed in the “passport” they specialize. Thus, redundant companies for evaluation were eliminated and the sample was reduced.
Based on the answers, a screen of company logos was opened, the field of activity of which was related to the chosen direction. The respondent had to mark those he did not know about the working conditions. From here it turned out …
Recognition and attractiveness formulas
This is what the formula looks like recognizability…

Let us explain using the example of the leader of our rating, JetBrains: the company logo “dropped out for evaluation” by 1,098 respondents, 230 of whom said they could not evaluate the employer.

Attractiveness: We asked the remaining 868 people to choose, at their discretion, from 1 to 4 best (“Best”) and worst employers (“Worst”). Calculation formula:
![]()
In our example:

Of course, such a straightforward calculation is not entirely correct and we did not limit ourselves to it, since it is necessary to distinguish between situations when the attractiveness of the company was assessed by 1000 people and 100. The accuracy of the assessment will be different and, to take this into account, we include a confidence interval for each attractiveness. There could be a formula for calculating the confidence interval here, but to simplify our life, we will write that we took binom.confint function from binom package (328, 330, conf.level (confidence interval) = 0.85, methods = “wilson”). The resulting confidence interval removes the error by defining a nonzero reference point. After that, the JetBrains indicator becomes 98.4%.
It turns out that although the company does not have the highest recognition (for example, most banks or telecoms had almost 100% recognition, while JetBrains only 79%), the attractiveness ratio is very high – that is, almost everyone who knows this employer considers it among the “best”. “Who knows us – he loves us!” This is the power of the IT brand.
Further, the respondents, moving up the survey funnel, got to the third step – “Willingness to Buy”, where they evaluated JetBrains in detail (and other companies they chose among the “best” and “worst”), determining what characteristics the employer possesses or does not possess. Thus, the survey participants formed a portrait of the “ideal employer” and the image of each company separately.
When we analyzed the ratings of all companies according to the criteria, we saw that if the company was evaluated by at least 30 people, then 95% of the criteria are involved in the resulting aggregate brand portrait. As a result, out of 500 companies, only 79 companies were included in the long-list, assessed by more than 30 respondents. Why is there such a threshold for entry? The fact is that only at the third level it is possible to understand the respondents’ awareness of a particular company precisely as an employer: whether it has an established IT brand or not. For example, many companies with a strong b2c brand have high awareness (more than 90%) and good attractiveness. At the same time, no more than a dozen people can evaluate them as employers. People’s awareness of IT brands in this aspect is extremely low.
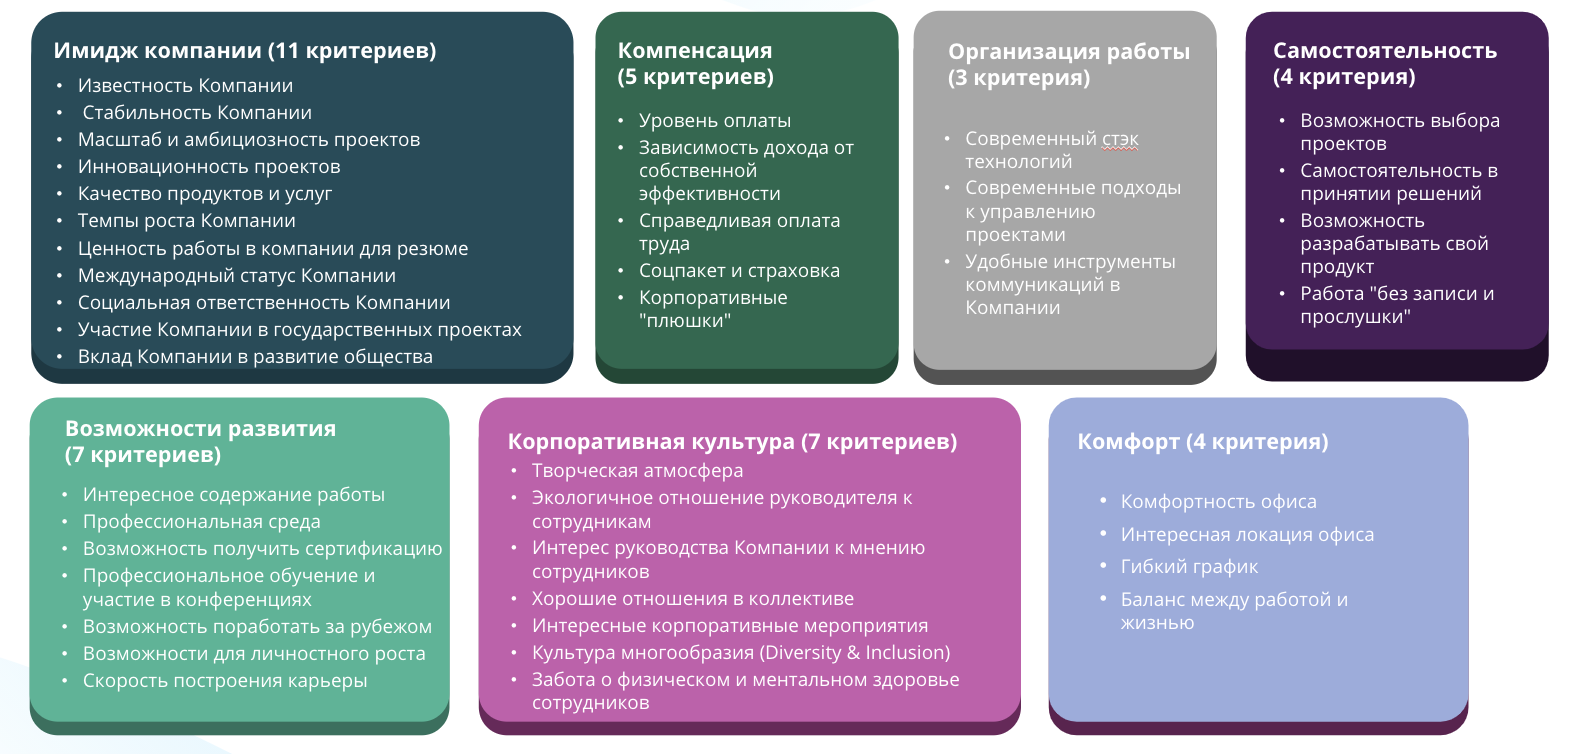
Employer Assessment Criteria Model
Below is the starting version: it consists of 41 criteria, with the help of which the survey participants and evaluated (here it is appropriate to recall expertswho helped us develop the survey methodology, in particular).
We analyzed the resulting impressive array of data using the following algorithm:
- We calculated what criteria are inherent and not inherent in each company, according to the survey participants. For example, JetBrains is not typical for “Company participation in government projects” and is highly typical for “Professional environment” (survey participants attributed this characteristic to it). This is how we got the image of the IT brand of each company.
- We looked at what criteria are differentiating, that is, they are not ascribed to all companies indiscriminately, but as “minus” for the worst companies and “plus” for the best ones.
We can say that we have built a regression model that predicts the attractiveness of the company. We called this property (ie β-coefficients) the “Significance” of the criterion for choosing an employer.
Criteria that are insignificant for increasing attractiveness that are not included in the factors of attractiveness:
- Company stability
- Company growth rate
- Company participation in government projects
- Convenient communication tools in the Company
- Independence in decision making
- Interesting work content
- Professional training and participation in conferences
- Opportunities for personal growth
- Creative atmosphere
- Caring for the physical and mental health of employees
Insignificant criteria – 10 criteria that add nothing to the “best” of the employer. That is, descriptions from the series “Our company is stable, it has a creative atmosphere, we participate in conferences”, most likely, will not go to an IT specialist. Either it is too long and “about nothing”, or it is banal, or they are not significant specifically for IT specialists (the same “Company Stability” is very much appreciated in the retail market, where it is very difficult for an applicant to find a job; an IT specialist, with his demand, we need not such basic factors, but something more advanced).
Finally, it was determined which of the 31 remaining criteria are significant.
| Criterion | Significance |
| Professional environment | 0.86 |
| Quality of products and services | 0.86 |
| The value of working in a company for a resume | 0.85 |
| Eco-friendly attitude of the manager towards employees | 0.75 |
| Payment level | 0.73 |
| Good team relationships | 0.71 |
| Interest of the Company’s management in the opinion of employees | 0.68 |
| Opportunity to work abroad | 0.67 |
| Modern technology stack | 0.66 |
| Innovativeness of the Company’s projects | 0.66 |
| The scale and ambition of the Company’s projects | 0.65 |
| Work “without recording and wiretapping” | 0.65 |
| Pay fairness in teams | 0.63 |
| The Company’s contribution to the development of society | 0.62 |
| Modern approaches to project management | 0.61 |
| Office comfort | 0.61 |
| Social responsibility of the Company | 0.60 |
| Social package and insurance | 0.58 |
| Flexible schedule | 0.57 |
| Dependence of income on your own efficiency | 0.57 |
| International status of the Company | 0.56 |
| Corporate “goodies” | 0.56 |
| Balance between work and life | 0.55 |
| Career building speed | 0.55 |
| Interesting corporate events | 0.53 |
| Company fame | 0.52 |
| Interesting office location | 0.51 |
| Opportunity to get certification | 0.51 |
| Ability to develop your own product | 0.49 |
| Choice of projects | 0.49 |
| Diversity & Inclusion Culture | 0.46 |
Returning to the ranking
The leaders of our rating are united by a pronounced characteristic – IT specialists appreciate them for a high-quality product, they believe that the professional environment here is developed at a high level, they see an opportunity to gain expertise and improve their relevance as a specialist with them. The survey participants also noted the high level of management and the international status of these companies, which makes it possible to use the modern technology stack, to join the innovative foreign experience.
Another important point is that the difference between the rating lines is often tenths of a percent. As in sports: fractions of a second separate “gold” from “silver”. This indicates a highly competitive market. There are many companies, there are many opinions about them, the players are actively fighting for their candidates, and every negative review or incorrect communication is important.
In the following publications, we will explore IT brands in more detail, show how the criteria are clustered into factors and compile separate ratings by factors. Subscribe to the blog to find out who turned down the best in Benefits and who turned down the best in Prestige. See you soon!
The article was prepared jointly with VikKaN