The fall of Slack on January 4, 2021

January 4, 2021, for many people around the world, as well as for most employees, Slack was the first working day after the new year (with the exception of the hotline and support specialists, who never sleep). On the day of Asia and the morning in Europe, it passed calmly, but when dawn broke in America, we began to receive messages from the external monitoring service about the increase in the number of errors. We began to figure out what was the matter. The error situation worsened and we initiated the incident investigation process (you can read more about how incident management works in our article in Ryan Katkov’s article All Hands on Deck https://slack.engineering/all-hands-on-deck/).
As if this was not enough for us to completely ruin the first working day of the new year, at that moment, we were trying to understand what was happening, the services of dashboards and notifications fell. We contacted the monitoring group to try to restore them as quickly as possible.
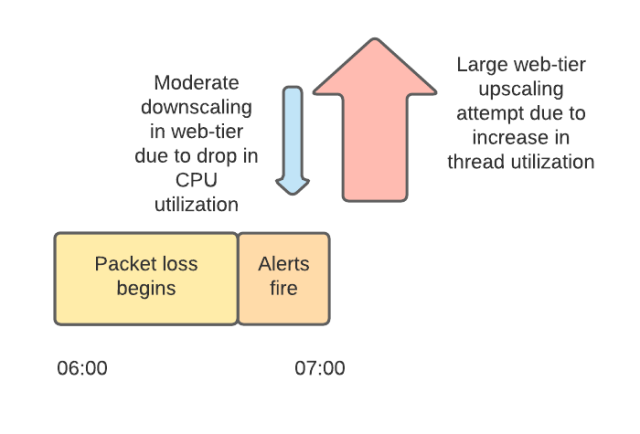
To shorten the list of possible reasons, we quickly rolled back some of the changes that were made today (looking ahead – it was not about them). We also connected a few more people from the infrastructure teams because the troubleshooting process was slow due to the fact that the dashboards and alerts were not working. We retained access to various internal consoles and status pages, to some console utilities, as well as to the log collection system. The metrics collection system also functioned and we could run queries to it directly, but this was not at all as effective as using our dashboards with pre-configured queries. While our infrastructure as a whole was functioning, we saw signs of network degradation, which we reported to AWS, our main cloud provider. At the time, Slack was working – at 6:57 am PST, 99% of messages were successfully delivered (although this was not the norm, since our typical value for this parameter is 99.999%).
Traffic in Slack has a characteristic burst at the beginning and middle of each hour when notifications and other types of automatically generated messages (most of them are external – cron tasks from all over the world). We have configured the scaling of the web service tier and backend to accommodate these spikes. However, the 7am load spike, coupled with network infrastructure issues, overwhelmed the web service link. As the load increased, packet loss began to grow. This, in turn, resulted in high latency and overloading of web service calls to the backend. Slack crashed.
During this time, two things were happening independently of each other. First, some instances were automatically flagged by the system as problematic because they could not reach the backend services they depended on. The system tried to replace them with new ones. Second, our auto-scaling system has reduced the size of the web service link. Since we worked without dashboards, some of the engineers who worked on this incident connected directly to the services running in production. Many of them started to lose their SSH sessions because the instances they were working with were disconnected by the system. This made it even more difficult for us to try to figure out the situation, so we turned off the automatic reduction of the size of the system. This made it easier to troubleshoot the problem and stabilized the performance of the system.
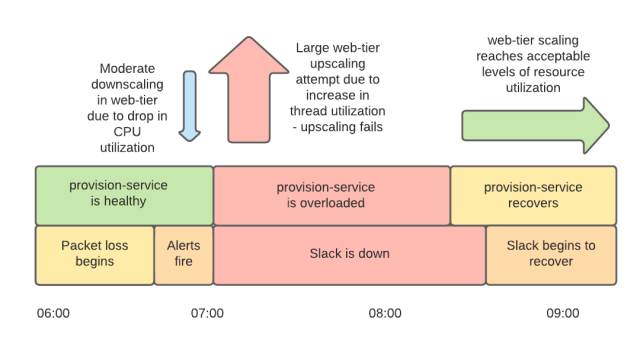
Our web services link scales based on two kinds of signals. One is CPU utilization (a metric that is used to scale almost everywhere) and the other is the load of available Apache worker threads. Networking issues before 7:00 meant that threads were idle for longer, resulting in less CPU utilization, which triggered an automatic reduction in the number of instances. As the network continued to deteriorate, causing the web service tier to wait longer for a response from the backend, resulting in increased workloads, the system automatically increased the number of web service instances. Between 7:01 am and 7:15 am, we tried to add 1200 servers to our web services tier.
Unfortunately, our scaling didn’t work as expected. We have a service aptly called “provision-service” and its name fully reflects its functionality, which includes configuring and testing new instances, as well as acting as a manager for the infrastructure. Provisioning needs to communicate with internal Slack systems and with the AWS APIs, and since this communication took place over the same unstable network and because, like most Slack systems at the time, it was spending more time connecting and receiving a response, and using more resources, than usual. The peak load associated with the need to introduce a large number of instances at the same time in an unstable network environment led to the fact that the provisioning service ran into system limits (the most significant of which was the limit on the number of open files on Linux, but AWS quotas were also exceeded).
While we were trying to get the provisioning back up and running, the web services tier remained underperforming to restore normal operation due to the system scaling not working as expected. We had a large number of instances running, but most of them were not fully configured by the provisioning service and did not work. The high number of failed instances resulted in us reaching the pre-set autoscale limit for our web services tier, which is a multiple of the number of instances normally required to handle peak traffic. Some of the specialists working on this incident started manually deleting the non-working instances, the rest continued to search for the source of the problem. In addition to all this, we still did not have the dashboard service working, we could not start it due to the fact that the provisioning service was overloaded.
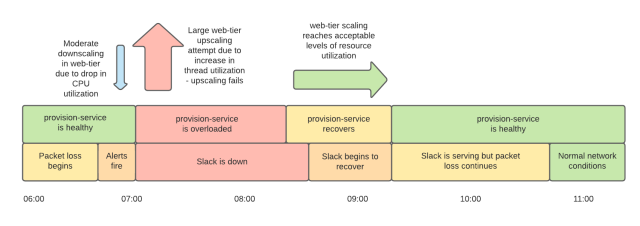
At one point, the provisioning service started up (it was about 8:15 am) and started launching running instances. The situation began to improve little by little. We still had some problems with the product, some of which were mitigated, while others were in the process of being resolved. We have also experienced problems with increased packet loss on the network so far. Regardless, at 9:15 am, our web services tier had enough working nodes to digest the incoming traffic. Due to network problems, load balancers showed a large number of problematic nodes, but luckily they were in “panic mode” https://www.envoyproxy.io/docs/envoy/latest/intro/arch_overview/upstream/load_balancing/panic_threshold in which the balancers begin to distribute the load to all nodes, regardless of the results of checking their condition. This, plus re-connections and the circuit breaking pattern, helped us get the service back online. Yes, Slack was slower than usual, and the error rate was higher, but at 9:15 it was already working, and not lying, as before. It took a full hour to bring the error rate down to an acceptable level for two reasons. First, due to network instability, we needed more instances than usual to properly handle incoming traffic. Secondly, more time was spent on the deployment process, again due to network problems.
By the time Slack recovered, AWS engineers had found the cause of the failure: part of our AWS network infrastructure was indeed overloaded, leading to packet loss.
To make it easier to understand what happened, it’s worth telling a little more about some of the architectural features of Slack. At the start, not too many years ago, everything related to Slack worked in one AWS account. As the size, complexity and the number of specialists involved in maintaining the system grew, we abandoned this solution and distributed the services to various accounts and VPCs (Virtual Private Clouds). This solution allowed us to achieve greater isolation between various services, and allowed us to more accurately control the privileges of operators. In order to link our VPCs, we used AWS Transit Gateways (TGWs) as a hub.
On January 4th, our TGWs were overloaded. TGWs are hosted by AWS and are supposed to scale out of the way. But in the first days after the new year, Slack traffic has an unusual structure, it is lower on weekends, because everyone is distracted from work (well done, that you maintain a balance of work and personal life, Slack users, keep it up!). On the first working day, the client caches are not warmed up and on the first connection they load more data than usual, after several days of calm, the load grows to the highest values in a year, literally within one night.
Our systems allow you to quickly scale system performance to handle this kind of workload (and we’ve always done well in years past). But our TGWs weren’t able to scale fast enough. During this incident, AWS was alerted to our problem with packet loss by their internal monitoring and manually increased the capacity of the TGWs. By 10:40 am, this change took effect across all Availability Zones and our network was back to normal, with normal error and latency levels returning.
AWS assured us that in the course of investigating this incident, they revised the TGW scaling algorithms for spikes in traffic. And we set ourselves a reminder (of course it was a reminder from Slack slack.com/intl/en-ie/help/articles/208423427-Set-a-reminder) preemptively increase the capacity of TGWs at the end of the next New Year holidays.
conclusions
Monitoring is one of our most critical services – it helps us know if the services that users interact with are in order, and it is also one of our most important tools for identifying problems. We work hard to keep our monitoring tools as independent as possible from the Slack infrastructure so that they are available when we need them most. In this situation, our dashboards and alerts fell because the databases from which they took information ended up located in a different VPC, which led to dependence on TGWs. Running them in one VPS will get rid of this dependency.
We also made a decision in the future to regularly carry out load testing of the provisioning service in order to eliminate problems with scaling (we did this before, but in this case we exceeded the parameters of our previous tests). We will also review our service health control configurations, as well as autoscale configurations, in order to further avoid such an overload of the provisioning service, even in the event of extreme conditions, such as an unstable network connection.
We deeply regret the interruption to our application. Each incident is an opportunity to learn and an unplanned contribution to improving the reliability of the service in the future. We have learned a lot from this disruption and, as always, we intend to use this unplanned investment to improve our infrastructure in 2021 and beyond.
Cloud servers from Macleod fast and safe.
Register using the link above or by clicking on the banner and get a 10% discount for the first month of renting a server of any configuration!