The cheapest spectrometer Hopoocolor HPCS-320
A spectrometer is a device that allows you to see the spectrum of any light source and measure the color temperature, color rendering indexes, illumination and other light parameters.
I studied the world’s cheapest mass-produced spectrometer and compared it to much more expensive instruments.
By a happy mistake, I ended up with a Chinese spectrometer for a week (the reader forgot it in my laboratory) and I studied it carefully.
Here’s what the manufacturer promises:
measurement
1. CCT Tc(K) and Blackbody deviation Duv
2. light illumination E (LX), candlelight E (Fc)
3. chromaticity coordinates (x, y), (U, V), (U’, V’)
4. relative spectral power distribution P (lambda)
5. color index Ra, Ri (i=1~15)
6. color tolerance SDCM
7. Dominant wavelengths, peak wavelengths
8. Visual ratio of light and shade S/P
9. color purity, red ratio, green ratio, blue ratio, CIE1931 three basic color stimulus value X, Y, Z
Wavelength Range: 380nm~780nm
Measurement Range: 380nm~780nm
Integrating Time: 50µs~10000ms
Illuminance Range: 5lx~200klx
CCT Range: 1,000K~100,000K
Display: 3.5 inch HD IPS LCD
Material: Aluminum Alloy
Warranty: 24 Months
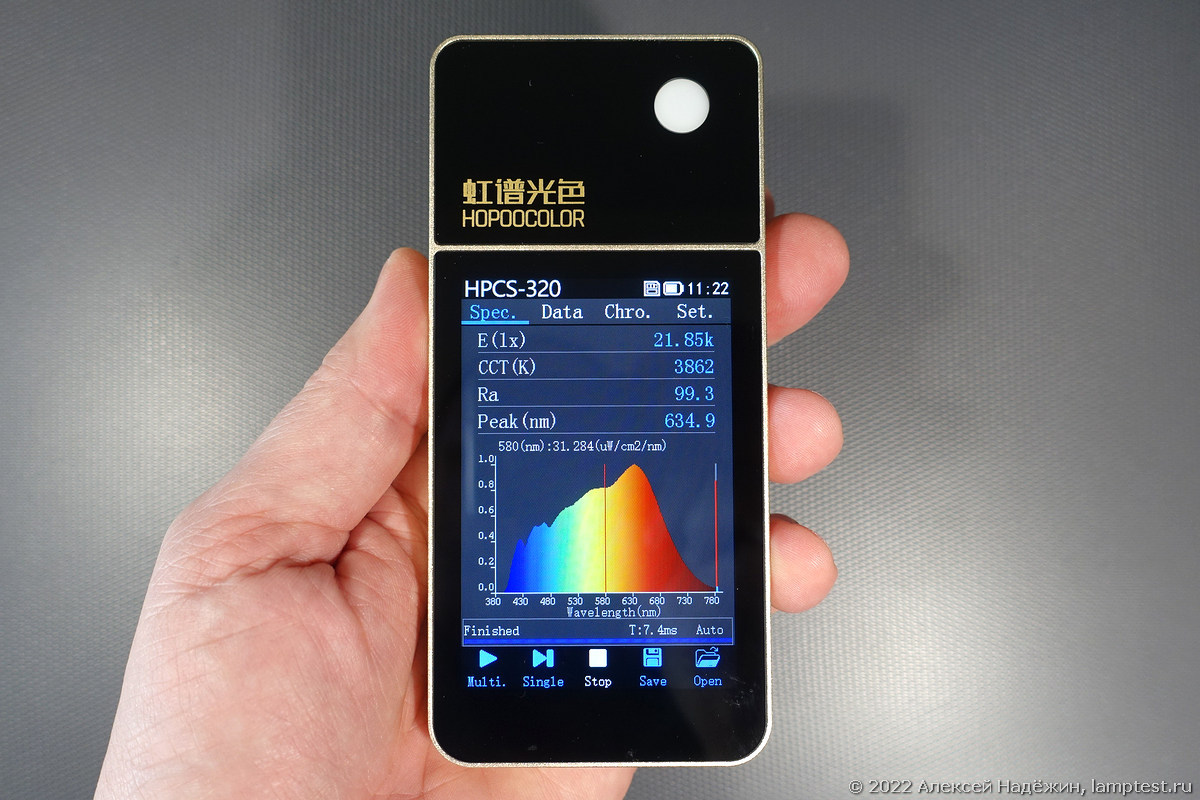
The sensor window is unexpectedly located on the same side as the screen (it would be more convenient if it was at the end or back of the device). On all renders in the store there are two windows (apparently they also wanted to put a pulsation sensor, but “nishmagli”), actually one. I assumed that there are different modifications, but all the photos from the reviews also have one window.

On the right is the only button. It turns the device on and off and performs one of two functions – starts a measurement or takes a screenshot.

At the back of the body there is a thread for a standard photo tripod.

The screen is touch-sensitive and all control is carried out using it.
On the main screen is the spectrum (you can move the red line along it and see the levels at each point), four parameters (illuminance, color temperature, Ra and peak wavelength) and control buttons.

The Single button starts the measurement, the Multi button starts, and the Stop stops the cyclic measurement (the spectrometer makes a measurement, displays the results and immediately does the next), the Save button saves the data to the internal flash drive (you can assign your own name or the file will have a name from hours, minutes and seconds since saving), the Open button opens the saved data.
The buttons at the top switch between results and settings tabs. The first tab is the spectrum, the second one displays all the measured parameters (there are a lot of them, you need to scroll the screen).

On the third tab, you can scroll through six screens with the results of measuring color parameters.

On the fourth – settings.

The four parameters displayed on the spectrum screen can be changed, but, alas, after turning it off, this is not saved. Here, for example, I set the display to R6-R10 instead of the peak wavelength.

This spectrometer does not have applications for a computer or mobile devices. It can be connected to a computer (USB Type C connector), but for a computer it is simply an external drive on which data folders are located.

The easiest way to save data is screenshots. The screenshot option is enabled in the system settings and works until it is turned off (next time it will have to be turned on again). A screenshot can be taken on any screen by pressing the physical button. At the same time, the spectrometer emits a long (5 seconds) nasty squeak. The screenshot is saved in bmp format, 307254 bytes in size with a resolution corresponding to the device screen – 320×480 pixels. Screenshots are saved in the appropriate folder and are named by date and time, for example 20220216123058.bmp. For some reason, the screenshot function does not work if autosave data is enabled.
When you click the Save button (or every time you take a measurement, if autosave is enabled), two files are created. The first with the extension ohs contains data in its own format.

In hexadecimal form, it is not clearer at all. 🙂

The second with the CSV extension is text, and despite the strange symbols at the beginning, everything is quite clear with it.
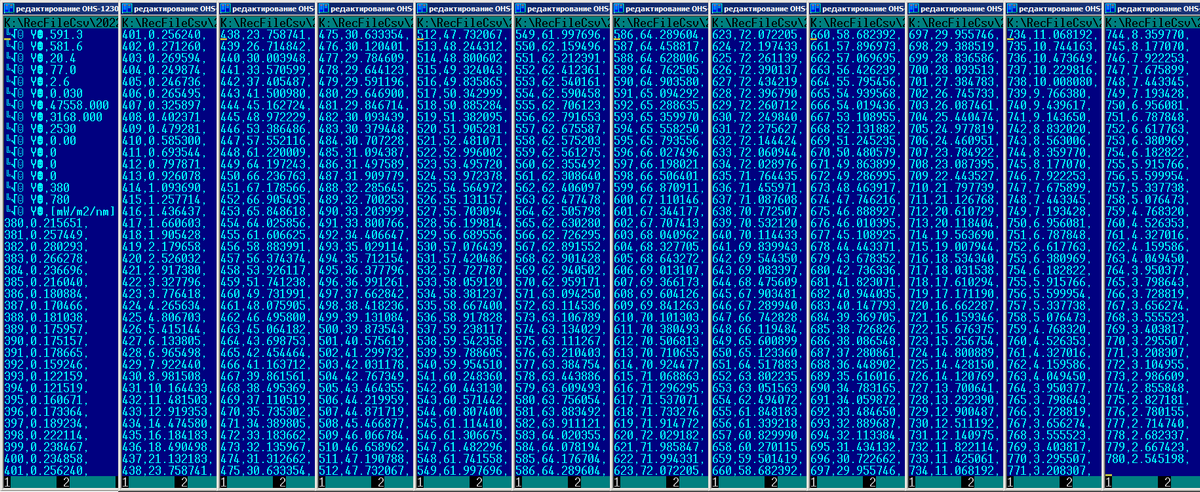
I think it’s not difficult to write a program that converts this file into a text file of data from the Uprtek spectrometer for processing by the uSpectrum program from it (in addition to beautiful data display and reports, a TM-30 calculation will appear).
To check the calibration of spectrometers, a fluorescent lamp is usually used, since its spectrum has four distinct peaks – 404.7, 435.8, 546.1 nm (mercury peaks) and 611 nm (europium peak). I measured the spectrum of such a lamp.

According to the CSV data file, peaks were obtained at 403, 434, 544, 611 nm. The discrepancy is within acceptable limits (for comparison, on the same lamp, Uprtek MK350D 404, 434, 545, 613 nm).
I compared the measurements of fourteen lamps, including 12 LEDs (ranging from a very poor lamp with a CRI of about 60, ending with solar spectrum Sunlike LED lamps), one incandescent and one fluorescent.
I previously measured the parameters of most of these lamps in the integrating sphere using a professional Instrument Systems CAS 140 CT spectrometer (in the table – IS), and now I measured them with Uprtek MK350D spectrometers (in the Uprtek table) and Hopoocolor HPCS-320 (in the Hopoo table) , placing both spectrometers 20 cm from the lamp.

When measuring the parameters of all lamps, except for the worst, the discrepancy in color temperature between Uprtek and Hopoocolor turned out to be no more than 3%, the discrepancy in color rendering index was not more than 2%, the discrepancy in illumination was not more than 6% (I note that the special accuracy of the distance between the lamp and was not maintained by the spectrometer). These are quite decent results.
Of course, a cheap Chinese spectrometer has drawbacks – this is an inconvenient location of the sensor window, and the inability to control from a computer, and the lack of software for a computer and smartphone, and firmware flaws (there is no remembering the choice of parameters on the main screen, the screenshot function is not very conveniently implemented, freezing when attempting to take a screenshot when autosave is enabled). But its measurement accuracy is quite high, and the price is significantly lower than all other commercially available spectrometers.
© 2022, Alexey Nadezhin


If I had the two files I’d be able to judge better, but what I see in that binary file is a bunch of 32-bit floating point values in little endian.