Taming the Data-Oriented Service Grid

On October 22nd we introduced Viaduct – what we call data-oriented service grid… It seems to us to be a step towards improving the modularity of our service-oriented architecture (SOA) based on microservices. Here we will introduce Viaduct’s philosophy and give a rough sketch of how it works. For details please watch the video presentation…
Large SOA dependency graphs
For a while, service-oriented architectures have been moving towards more and more small microservices. Modern applications can consist of thousands and tens of thousands of microservices connected without restrictions. As a result, you can often see the following dependency graphs:
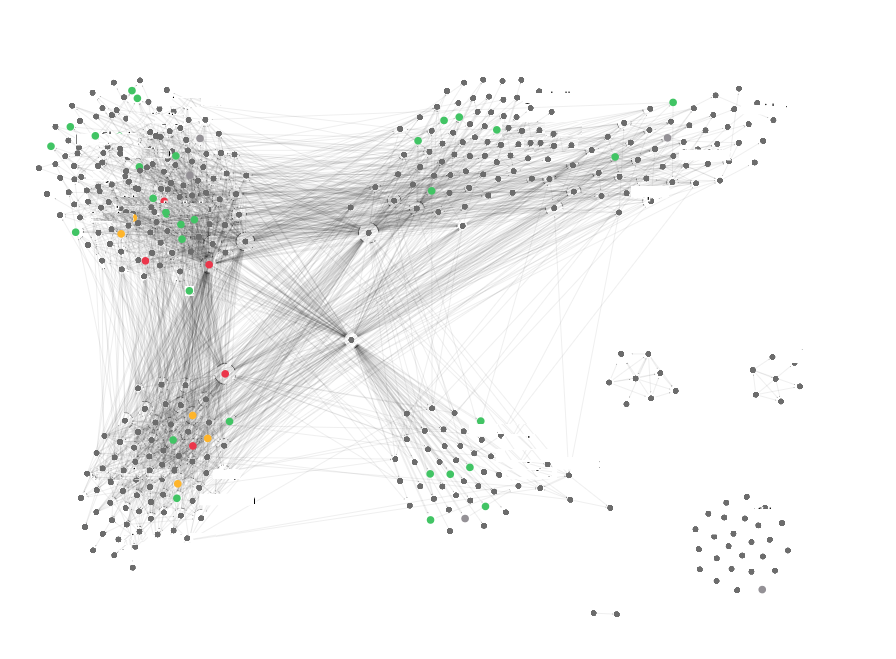
It’s a dependency graph on Airbnb, but it’s not uncommon. Amazon, Netflix, and Uber are examples of companies working with similar dependency graphs.
Such graphs resemble spaghetti codebut at the microservice level. Just as spaghetti code gets harder and harder to change over time, so changes and spaghetti SOA get harder. To help manage a large number of microservices, we need organizational principles as well as technical measures to implement them. We tried to find such measures and principles. The research led us to the concept of a data-driven service grid, which we believe brings a new level of modularity to SOA.
Procedural and Data-Oriented Design
Organizing large programs into modular units is not a new problem in software engineering. Until the 1970s, the main paradigm for organizing software focused on grouping code into procedures and procedures into modules. With this approach, modules publish a public API for use by other code outside the module; behind this open API, modules hide internal helper procedures and other implementation details. Languages such as Pascal and C. are based on this paradigm.
Since the 1980s, the procedural paradigm has shifted towards organizing software primarily around data rather than procedures. In this approach, modules define object classes that encapsulate the internal representation of an object, accessing the view through the public API of the object’s methods. The pioneers of this form of organization were Simula and Clu.
SOA is a step back to more procedural constructs. Today’s microservice is a set of procedural endpoints – a classic 1970s style module. We believe that SOA should evolve to support data-driven design, and that this evolution can be driven by moving our service grid from procedural to data-driven.
Viaduct: data-oriented service-grid
Central to today’s scalable SOA applications is service grid (eg Istio, Linkerd) that directs service calls to microservice instances, which in turn can process them. Today’s industry standard for service meshes is to organize itself exclusively around RPCs without knowing anything about the data. Our vision is to replace these procedural service grids with service grids that are organized around the data.
On Airbnb GraphQL️ is used to build a data-oriented service grid called Viaduct… Service grid Viaduct is defined in terms of a GraphQL schema consisting of:
- types (and interfaces) that describe the data managed in your service mesh;
- requests (and subscriptions) that provide a means of accessing this data, which abstract from the service entry points that provide this data;
- mutations that provide ways to update data, again abstracted from service entry points.
Types (and interfaces) in a schema define a single graph for all data managed within a service network. For example, in an e-commerce company, the service network diagram might define the field productById (id: ID)which returns results like Product… From this starting point, a single query allows the data consumer to navigate to information about the product manufacturer, for example productById {Manufacturer}, product reviews, for example productById {reviews} and even about the authors of reviews, for example productById {reviews {author}}…
The data items requested by such a query can come from many different microservices. In a procedure-oriented service grid, the data consumer must treat these services as explicit dependencies. In our data-driven service grid, it is the service grid, that is, Viaduct, not the data consumer, that knows which services are providing which data item. Viaduct abstracts the dependencies of a service from any single consumer.
Placing the diagram in the center
Here we will discuss how unlike other distributed GraphQL systems such as GraphQL Modules or Apollo Federation Viaduct treats the schema as a single artifact and implements several primitives that allow us to maintain a single schema while allowing many teams to collaborate productively on this schema. As Viaduct replaces more and more of our basic procedure-oriented service networks, its schema more and more captures the data driven by our application.
We took advantage of this “central schema,” as we call it, as a place to define the APIs for some microservices. In particular, we started using GraphQL for the API of some microservices. The GraphQL schemas of these services are defined as a subset of the central schema. In the future, we want to take this idea further by using a central schema to define the schema of the data stored in our database.
Among other things, using a central schema to define APIs and database schemas will address one of the biggest challenges in large-scale SOA applications: data mobility. In modern SOA applications, changing the database schema often requires manual reflection in APIs of two, three, or sometimes more microservice layers before it can be exposed to client code. Such changes may require weeks of coordination across multiple teams. By retrieving the service APIs and database schema from a single central schema, such a database schema change can be propagated to the client code in a single update.
Come to serverlessness
Often in large SOA applications, there are many stateless “derived data” services as well as “front-end back-end” services that take raw data from lower-tier services and transform it into data more suitable for presentation to clients. This stateless logic is well suited to the serverless computing model, which completely eliminates the operational overhead of microservices and instead places the logic in a “cloud function” framework.
Viaduct has a mechanism for computing what we call “derived fields” using serverless cloud functions that work on a graph without knowing the underlying services. These functions allow you to move transformational logic from the service network to stateless containers while keeping the graph clean and reducing the number and complexity of required services.
Conclusion
Viaduct is built on graphql-java and supports granular selection of fields using GraphQL selection sets. Viaduct uses modern methods of loading data, as well as reliability techniques such as short-circuiting and soft dependencies, and implements a cache within the request. Viaduct provides observability of data, allowing us to understand down to the field level which services are consuming which data. As a GraphQL front-end, Viaduct takes advantage of a large ecosystem of open source tools including Live IDEs, server stubs, and schema renderers.
Viaduct began supporting manufacturing processes at Airbnb over a year ago. We started from scratch with a pure multi-entity schema and extended it to include 80 core entities that can handle 75% of our modern API traffic.

- Data Science profession training
- Data Analyst training
- Data Analytics Online Bootcamp
- Python for Web Development Course
- Training for the profession of C # developer
- Advanced Course “Machine Learning Pro + Deep Learning”
- Course “Mathematics and Machine Learning for Data Science”
- Machine Learning Course
- Unity Game Developer
- Profession Web developer
- Java developer profession
- JavaScript course
- C ++ developer
- Data Analytics Course
- DevOps course
- The profession of iOS developer from scratch
- Profession Android developer from scratch
Recommended articles
- How to Become a Data Scientist Without Online Courses
- 450 free courses from the Ivy League
- How to learn Machine Learning 5 days a week for 9 months in a row
- How much does a data analyst earn: an overview of salaries and vacancies in Russia and abroad in 2020
- Machine Learning and Computer Vision in the Mining Industry