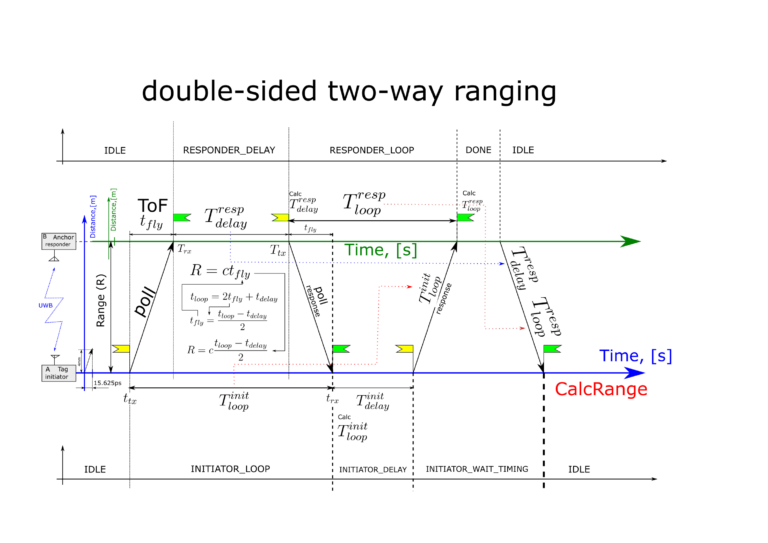
Sktime: a unified Python library for machine learning and time series
Solving data science problems in Python is not easy.
Why? The existing tools are poorly suited for solving problems related to time series and these tools are difficult to integrate with each other. Scikit-learn’s methods assume that the data is structured in a tabular format and that each column consists of independent and equally distributed random variables – assumptions that have nothing to do with time series data. Packages that have modules for machine learning and time series work, such as statsmodelsare not very good friends with each other. Moreover, many important operations with time series, such as splitting data into training and test sets over time intervals, are not available in existing packages.
To solve such problems, and was created sktime…

Sktime is an open source Python machine learning toolkit designed specifically for working with time series. This project is community developed and funded by the UK Council for Economic and Social Research, center Consumer Data Research and Alan Turing Institute…
Sktime extends the scikit-learn API for solving time series problems. It contains all the necessary algorithms and transformation tools for efficiently solving problems of time series regression, forecasting and classification. The library includes special machine learning algorithms and transformation methods for time series that are not found in other popular libraries.
Sktime was designed to work with scikit-learn, easily adapt algorithms for interrelated time series problems, and build complex models. How it works? Many time series problems are related to each other in one way or another. An algorithm that can be used to solve one problem can very often be applied to solving another related to it. This idea is called reduction. For example, a time series regression model (which uses a series to predict an output value) can be reused for a time series forecasting problem (which predicts an output value — a value that will be received in the future).
The main idea of the project: “Sktime offers easy-to-understand and integrable machine learning using time series. It has algorithms that are compatible with scikit-learn and model sharing tools, backed by a clear taxonomy of learning tasks, clear documentation, and a friendly community. “
In this article I will highlight some of the unique features sktime…
Correct data model for time series
Sktime uses a nested data structure for time series in the form of dataframes pandas…
Each line in a typical dataframe contains independent and equally distributed random variables – cases, and the columns – different variables. For methods sktime each cell in a Pandas dataframe can now contain an entire time series. This format is flexible for multidimensional, panel and heterogeneous data and allows you to reuse methods as in Pandasand in scikit-learn…
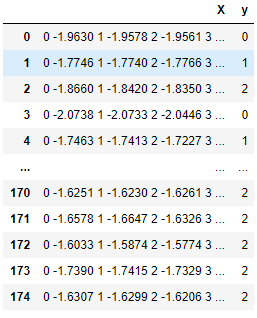
In the table below, each row is an observation containing an array of time series in column X and a class value in column Y. sktime evaluators and transformers are adept at working with such time series.
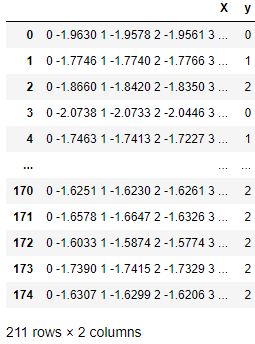
A native sktime compatible time series data structure.
In the following table, each element of the X series has been moved to a separate column as required by scikit-learn methods. The dimension is quite high – 251 columns! In addition, the time ordering of the columns is ignored by learning algorithms that work with tabular values (but used by time series classification and regression algorithms).
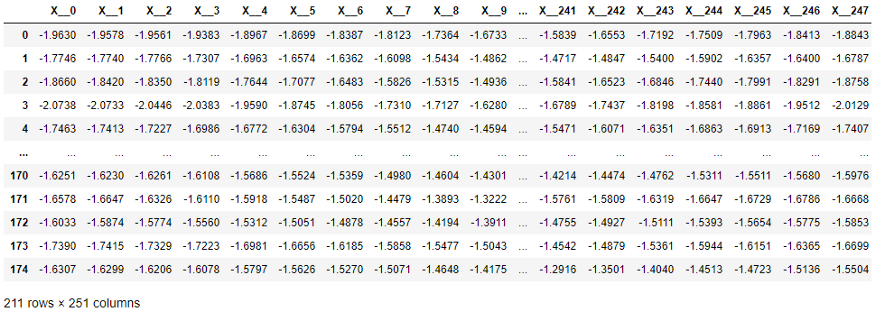
Time series data structure required by scikit-learn.
For modeling tasks of multiple joint series, a native time series data structure that is compatible with sktime, fits perfectly. Models trained on tabular data expected scikit-learnare bogged down in a lot of signs.
What can sktime?
According to the page on Github, sktime currently provides the following features:
- Modern algorithms for time series classification, regression analysis and forecasting (ported from the toolkit
tsmlin Java); - Time series transformers: transformations of single series (for example, detrending or deseasonization), transformations of series as features (for example, extraction of features), and tools for sharing multiple transformers.
- Pipelines for transformers and models;
- Setting up the model;
- An ensemble of models, for example, a fully customizable random forest for classification and time series regression, an ensemble for multivariate problems.
Sktime API
As said before, sktime supports basic scikit-learn API with class methods fit, predict, and transform…
For evaluator classes (or models) sktime provides method fit to train the model and method predict to generate new forecasts.
Appraisers in sktime extend scikit-learn regressors and classifiers by providing analogs of these methods that can work with time series.
For transformer classes sktime provides methods fit and transform to transform the series data. There are several types of transformations available:
- Tabular data transformations, such as principal component analysis, that operate on instances of independent and equally distributed random variables;
- Series-to-primitive transformations that convert the time series in each row to primitive numbers (for example, feature transactions);
- Converting series to other series (for example, Fourier transform);
- Detrending transformers return a time series in the same domain as the input series (for example, seasonal detrending).
Code examples
Time series forecasting
The next example is an adaptation of the forecasting guide from Github… The series in this example (the Box-Jenkins airline dataset) shows the number of international aircraft passengers per month from 1949 to 1960.
First, load the data and split it into training and test suites, and make a graph. IN sktime there are two convenient functions to easily accomplish these tasks – temporal_train_test_splitforwhich will split the dataset by time and plot_ys, which will plot graphs based on test and training samples.
from sktime.datasets import load_airline
from sktime.forecasting.model_selection import temporal_train_test_split
from sktime.utils.plotting.forecasting import plot_ys

y = load_airline()
y_train, y_test = temporal_train_test_split(y)
plot_ys(y_train, y_test, labels=["y_train", "y_test"])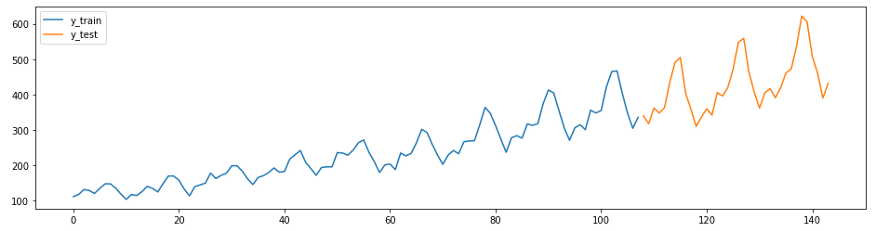
Before making complex forecasts, it is useful to compare your forecast with the values obtained using naive Bayesian algorithms. A good model should exceed these values. IN sktime there is a method NaiveForecaster with different strategies for generating baseline forecasts.
The code and diagram below show two naive predictions. Fortuneteller with strategy = “last” will always predict the last value of the series. Fortuneteller with strategy = “seasonal_last” predicts the last value of the series for a given season. The seasonality in the example is set as “sp=12”, that is, 12 months.
from sktime.forecasting.naive import NaiveForecaster

naive_forecaster_last = NaiveForecaster(strategy="last")
naive_forecaster_last.fit(y_train)
y_last = naive_forecaster_last.predict(fh)

naive_forecaster_seasonal = NaiveForecaster(strategy="seasonal_last", sp=12)
naive_forecaster_seasonal.fit(y_train)
y_seasonal_last = naive_forecaster_seasonal.predict(fh)

plot_ys(y_train, y_test, y_last, y_seasonal_last, labels=["y_train", "y_test", "y_pred_last", "y_pred_seasonal_last"]);
smape_loss(y_last, y_test)
>>0.231957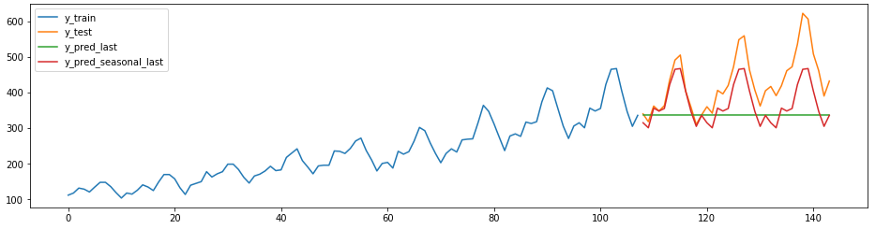
The following prediction snippet shows how existing sklearn regressors can be easily, correctly and with minimal effort adapted for prediction tasks. Below method ReducedRegressionForecaster of sktime predicts a series using a model sklearnRandomForestRegressor… Under the hood sktime splits the training data into windows of 12 so the regressor can continue training.
from sktime.forecasting.compose import ReducedRegressionForecaster
from sklearn.ensemble import RandomForestRegressor
from sktime.forecasting.model_selection import temporal_train_test_split
from sktime.performance_metrics.forecasting import smape_loss

regressor = RandomForestRegressor()
forecaster = ReducedRegressionForecaster(regressor, window_length=12)
forecaster.fit(y_train)
y_pred = forecaster.predict(fh)

plot_ys(y_train, y_test, y_pred, labels=['y_train', 'y_test', 'y_pred'])
smape_loss(y_test, y_pred)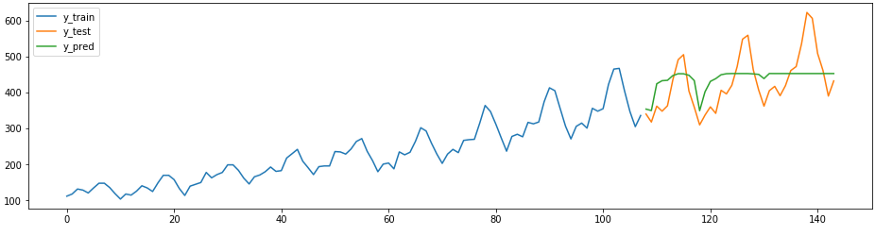
IN sktime also have their own forecasting methods, for example AutoArima…
from sktime.forecasting.arima import AutoARIMA
forecaster = AutoARIMA(sp=12)
forecaster.fit(y_train)

y_pred = forecaster.predict(fh)
plot_ys(y_train, y_test, y_pred, labels=["y_train", "y_test", "y_pred"]);
smape_loss(y_test, y_pred)
>>0.07395319887252469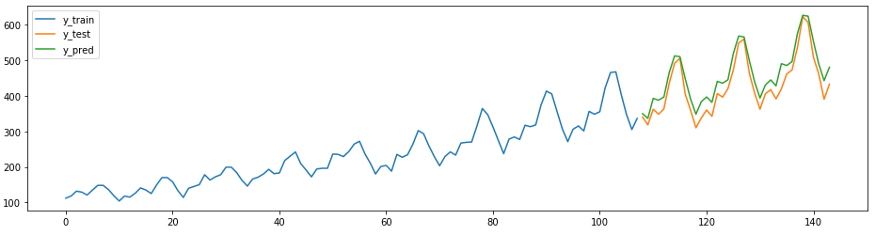
To dive deeper into the forecasting functionality sktime, check out the manual link…
Time series classification
Also sktime can be used to classify time series into different groups.
In the code example below, the classification of single time series is made as easy as the classification in scikit-learn. The only difference is the nested time series data structure we talked about above.
from sktime.datasets import load_arrow_head
from sktime.classification.compose import TimeSeriesForestClassifier
from sklearn.model_selection import train_test_split
from sklearn.metrics import accuracy_score

X, y = load_arrow_head(return_X_y=True)
X_train, X_test, y_train, y_test = train_test_split(X, y)
classifier = TimeSeriesForestClassifier()
classifier.fit(X_train, y_train)
y_pred = classifier.predict(X_test)
accuracy_score(y_test, y_pred)
>>0.8679245283018868
An example was taken from here pypi.org/project/sktime
Data passed to TimeSeriesForestClassifier
To learn more about series classification, see the tutorials on one-dimensional and multidimensional classification in sktime…
Additional resources for sktime
To learn more about Sktime, see the following links for documentation and examples.
- Detailed API description: sktime.org
- Sktime GitHub page (with documentation);
- Code examples;
- An article about Sktime: Markus Löning, Anthony Bagnall, Sajaysurya Ganesh, Viktor Kazakov, Jason Lines, Franz Király (2019): “sktime: A Unified Interface for Machine Learning with Time Series”
Logistic regression for data classification. Free webinar.