Seagate FireCuda 530 benchmark – Seagate’s fastest SSD
Seagate previously unveiled one of the first NVMe SSDs with PCIe 4.0 support, the FireCuda 520. It performed well in synthetic benchmarks, and now Seagate has unveiled a successor to the FireCuda 530. Let’s see how the new SSD performs. Can we call it the perfect drive for the enthusiast? We invite you to familiarize yourself with the test results that we carried out in conjunction with the Hardwareluxx laboratory.

Looking at the SSD market in recent years, the main trend is the move to PCIe4. The drives have advertised speeds well above the 3.6GB / s PCIe3 level, promising performance records. And in many tests we really got the declared level. However, day-to-day performance results weren’t quite as smooth. The FireCuda 520 is no exception here, which is not surprising due to the familiar platform on the Phison E16 controller with BiCS4 NAND and DDR4 DRAM.
Seagate has solved this problem in the new FireCuda 530, which is also a PCIe4 SSD, but in addition to high bandwidth, it performs well in everyday scenarios. Externally, the drive differs little, but the changes inside are quite significant: a new Phison PS5018-E18 controller and a new 176-layer NAND from Micron, which allowed to achieve write speeds up to 6.900 MB / s and read speeds up to 7.300 MB / s. Seagate has also addressed two flaws in the FireCuda 520: in addition to the 2TB test sample, there are also 500GB, 1TB and even 4TB models. However, the move to the new Micron NAND memory with an increased number of layers allowed the release of SSDs with a new level of capacity. In addition, all drives are available in two versions: with or without an additional heatsink. The warranty is five years.
Model | Seagate FireCuda 530 2 TB |
Controller | Phison PS5018-E18 |
Cache | 2 × 1 GB DDR4-2666 SK Hynix (H5AN8G6NCJ) |
NAND | Micron 3D TLC (176 layers) |
Capacity options | 500 GB 1 TB 2 TB 4 TB |
Sequential read / write speed | Up to 7.300 MB / s read and 6.900 MB / s write |
Functions: | Heatsink options available |
Total Bytes Written (TBW) | 500 GB: 640 TB 1 TB: 1.275 TB 2 TB: 2.550 TB 4 TB: 5.100 TB |
Mean time between failures (MTBF) | 1.8 million hours |
Guarantee | 5 years |
Price | From 31.200 ₽ (2 TB) |
As befits a flagship, the FireCuda 530 has a high-end Phison E18 controller. Seagate also opted for Micron’s latest NAND, which contains 178 layers. This move reduced latency as well as increased storage density. As we stated above, Seagate took advantage of this opportunity to announce a 4TB capacity option. But the PCB of our test sample was already densely filled with chips, despite the 2TB capacity.
Of course, it was quite interesting to see how the pseudo-SLC cache works in combination with a top controller and new NAND memory. Almost all TLC NVMe drives show maximum write performance only in situations where data is written to a cache that mimics an SLC SSD. In the case of an empty Seagate FireCuda 530, the maximum speed was observed for about a minute and a half, after which the write speed dropped to 1.800 MB / s, then increased, then decreased, and so on.

If you fill the Seagate FireCuda 530 to 80%, which is better suited to everyday operating conditions, the results will be different. The FireCuda 530 peaks write speed for about 10 seconds, after which it drops sharply and shows fluctuations, as in the diagram above.
As a result, the Seagate FireCuda 530 can only be tentatively recommended for scenarios involving frequent recording of large volumes. On the other hand, for everyday scenarios, the performance is decent: the peak performance in an 80% full state can write about 55 GB. Which is much more than the usual recording volumes of most users.

To avoid throttling, Seagate decided to offer variants of the FireCuda 530 with heatsinks installed, although the FireCuda 530 never got as hot as its predecessor, even without a heatsink. However, it is better to purchase the version with a heatsink, or use a motherboard cooler, which many modern models have, since performance drops were found during the test. Recall that in the thermal throttling test, we write a large number of files in parallel and immediately erase them after the end of the write, so that performance does not run into the limitations of the SLC cache.
Seagate meets current standards in TBW write load design and warranty specifications and outperforms many SSDs on the market. For the 2 TB sample, the design load was 2.5 PB.
Test results
The test configuration is based on the ASUS ROG Strix B550-E Gaming motherboard, which has shown convincing results in storage performance. We continued to use the AMD Ryzen 5 3600 processor on the ASUS motherboard, which delivers excellent performance with six cores and 12 threads.
Software components:
Microsoft Windows 10 Home (Build 21H1)
AS SSD Benchmark 2.0.6485.17676
AS SSD Benchmark 1.7.4739.38088
Iometer 1.1.0
Futuremark PCMark 8 v2.0.228
CrystalDiskMark 7 + 8
ATTO Disk Benchmark v3.05
Hardware components:
AMD Ryzen 5 3600
ASUS ROG Strix B550-E Gaming
Patriot Viper RGB DDR4-3200
NVidia Quadro CX
Samsung SSD 960 EVO (System Storage)
Enermax Saberay
Iometer
Iometer can be called a universal benchmark that measures the raw performance of a drive in almost every conceivable access scenario. The latest version of the test also has the ability to choose which data to use. In particular, the options “Repeating bytes” and “Full random” are interesting. The first option always uses the same duplicate data, so the controller can compress the data significantly. Not all controllers perform data compression, however, some controllers (the same SandForce) have a transparent compression system, which, depending on the data used, allows you to increase the throughput. The second option creates a 16MB data buffer with high entropy, and compressing such data is very difficult (if not impossible). All this allows performing two test runs on a controller with a built-in compression system, one of which operates with completely random data (“Full random”). The default run is “Repeating bytes” mode, which follows the manufacturer’s instructions.
Desktop systems are characterized by a minimal request queue (command queue depth, QD). Sometimes it may increase slightly, but it still remains within the range of single-digit values. QD 32 queue depth tests allow SSDs to reach their full potential. A similar depth of command queue is possible in normal situations, but only in a multiuser or server environment.
The 4K test uses 8 million logical 512-byte sectors; the sequential read / write test uses almost the full capacity of the drive.

The Iometer test on PCIe4 drives gives a rather large fluctuation, its results are not always easy to interpret. Therefore, we would not attach particular importance to this synthetic test. With a single queue depth, the Seagate FireCuda 530 showed write results at the level of its predecessor, but worse in reading. The same goes for QD 3. When the queue depth is increased to QD 32, there is no performance gain over the FireCuda 520. At least the FireCuda 510 is always left behind. The FireCuda 520 scores lower on sequential writes, and higher on sequential reads. Now the positions have changed.
AS SSD
The AS SSD test was developed, as the name suggests, specifically for SSDs. It uses completely incompressible data, so the test is a worst-case scenario for controllers with compression technologies. The sequential test and the 4K block test are performed with unit queue depth. Again, for desktop systems, the 4K unit QD 1 queue depth test is most important, and the QD 64 depth test again demonstrates the maximum capabilities of the SSD (with active NCQ
In contrast to the Iometer, the AS SSD results demonstrate the superiority of the FireCuda 530. In the QD 1 tests, it outperformed its predecessor in read speed, although it was slightly inferior in write. The gap from the FireCuda 510 is much more significant. In the QD 64 benchmarks, the FireCuda 530 beats its predecessor, but the FireCuda 510 gives better write performance. PCIe3 still dominates here, despite its age and the transition of modern SSDs to PCIe4. The Seagate FireCuda 530 is in absolute first place in sequential read and write speeds.
CrystalDiskMark
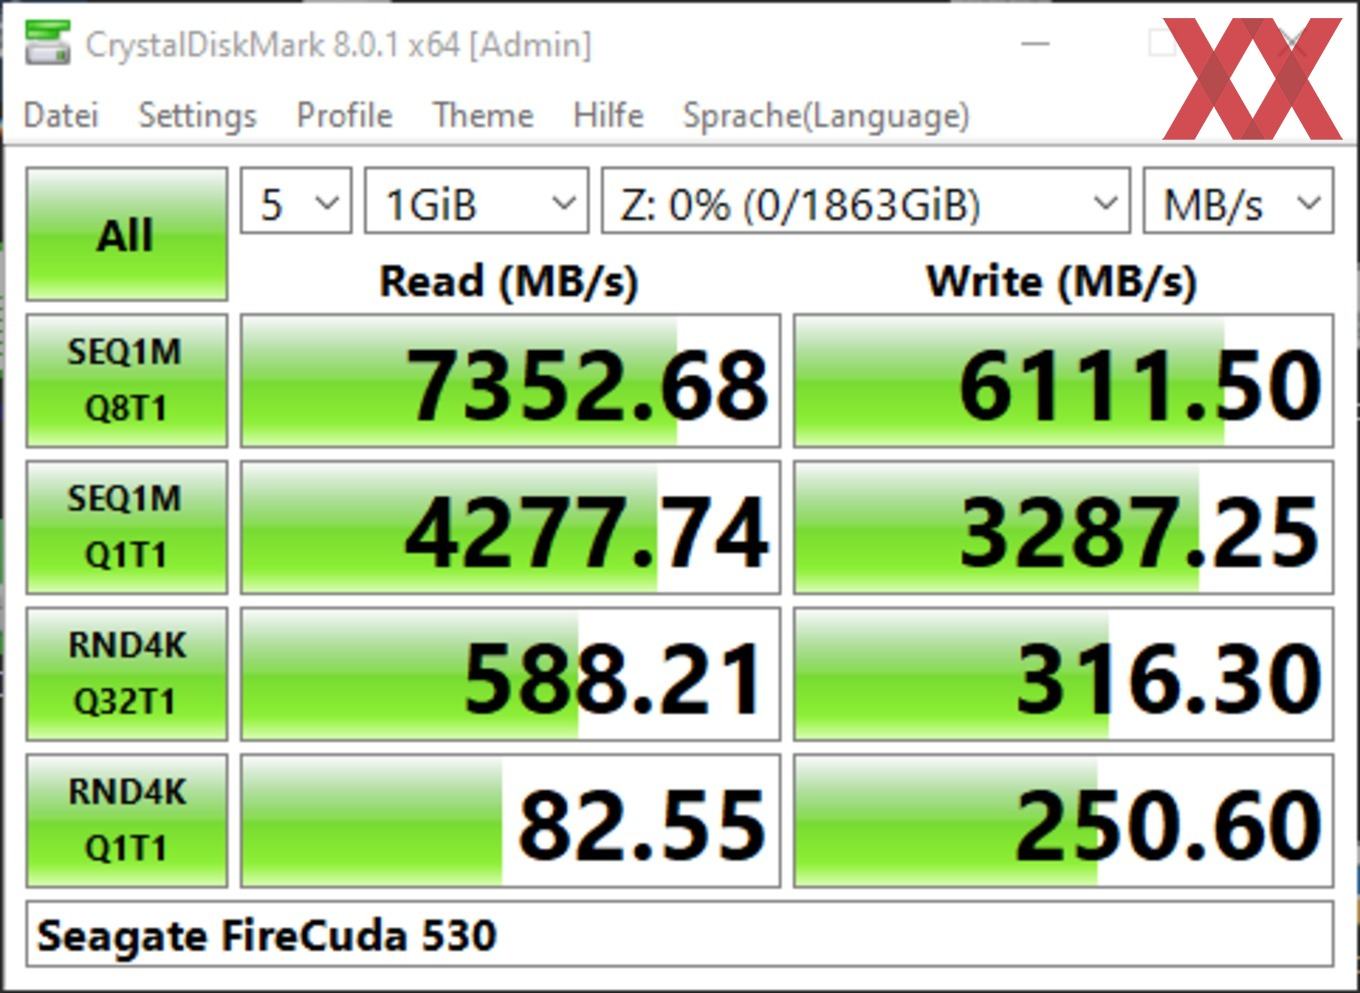
In the CrystalDiskMark benchmark, performance usually confirms the drive’s specs, but not always. In terms of read speed, we got more than 7.300 MB / s, but still did not reach the level of 6.900 MB / s in writing.
Data copy test
The data copy test, as the name suggests, shows how fast data can be copied. We ran tests for typical scenarios: ISO (two large files), programs (many small files), games (a mixture of small and large files).
In the copy test, the Seagate FireCuda 530 performed well, although it outperformed its predecessor in the ISO copy scenario. But the performance is still at a very high level.
Application performance
Synthetic tests are extreme cases. In day-to-day conditions, a computer uses a variety of access patterns, from small blocks of data to large sequential transmissions. We simulated a similar load by recording a pattern while using the system. We recorded the pattern while running the PCMark 8 test suite, which includes several applications, each reading and writing a certain amount of data, as you can see from the following table. Test data is not compressible.
Application profile | Total read | Total recorded |
Adobe photoshop | 468 MB | 5.640 MB |
Adobe After Effects | 311 MB | 16 MB |
Microsoft Word | 107 MB | 95 MB |
Microsoft PowerPoint | 83 MB | 21 MB |
World of warcraft | 390 MB | 5 MB |
Battlefield 3 | 887 MB | 28 MB |
Unlike the previous Futuremark PCMark 7 benchmark, the new version has removed idle time compression, so the pattern better matches real-world applications. We used to publish the PCMark score as a score, now we move on to theoretical throughput. It is calculated by dividing the amount of read and written data (see table) by the time it takes to process requests. Higher throughput means less drive latency and less application latency.
After the synthetic tests, it is time to turn to the tests of everyday scenarios. PCIe4 drives like the FireCuda 520 didn’t always perform well here. The situation is better with the new FireCuda 530.
Part of the reason for this marked improvement over its predecessor lies in Micron’s more modern NAND memory. The FireCuda 530’s performance is impressive in two gaming tests, where reads dominate, but the results start to drop as the share of reads increases. For example, this applies to two Photoshop tests, although in both cases the drive shows a level above 1,000 MB / s.
Conclusion
The FireCuda 530 has strengthened the advantages of its predecessor, and now there is another model on the list of recommendations for enthusiasts. The new drive combines very compelling qualities: state-of-the-art flash memory, DRAM cache, one of the fastest controllers on the market, capacities ranging from 500GB to 4TB, and SSD options with heatsinks. The high performance scores for applications and everyday scenarios make SSDs highly recommended for high-end systems. The latencies are low, and the drive performed well under stress testing conditions.
But the FireCuda 530 is not perfect either. For example, the high write performance of the SLC cache does not last long, which may alienate enthusiasts despite the good TBW load specifications. In terms of temperature throttling, the situation has improved compared to its predecessor, but other drives without a heatsink perform just as well.
Seagate FireCuda 530 Benefits:
Very high performance for applications and everyday scenarios
Very low latency
Very high TBW, 5-year warranty
Disadvantages of the Seagate FireCuda 530