PSI and CSI are the best metrics for monitoring model performance
Its author, Juhi ramzai, spoke about effective methods for checking models – PSI (population stability index) and CSI (stability index of characteristics).
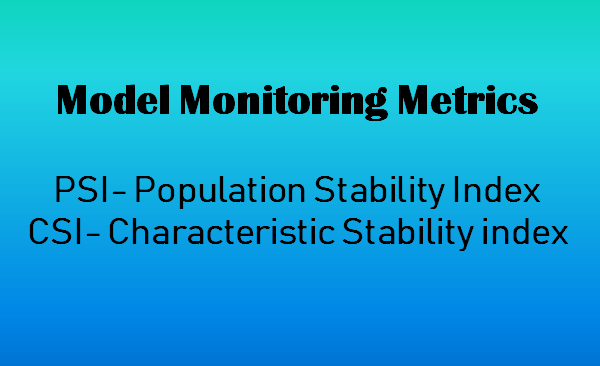 Image courtesy of the author
After a model is released into production, regular monitoring of its performance should be carried out to ensure that the model is still up to date and reliable. I wrote earlier post on model validation and monitoring of its performance, in which she emphasized the importance of these two stages.
Now let’s move on to the main topic of this post. We will learn all about PSI (Population Stability Index) and CSI (Stability Characteristics Index), which are some of the most important monitoring strategies used in many areas, especially in the area of credit risk assessment.
Both of these metrics (PSI and CSI) focus on changes in POPULATION DISTRIBUTION.
The basic idea behind these metrics is that the forecasting model works best if the data used to train it does not differ too much from the validation / OOT (out of time) data in terms of economic conditions, underlying assumptions, campaign style, focus, and etc.
For example, we developed a model to predict the churn rate of credit card users in a normal economic environment. Then we started testing this model, but already in the conditions of the economic crisis. It is possible that in this case the model will not produce an accurate forecast, since it will not be able to capture the fact that the distribution of the population could have changed significantly in different income segments (and this could lead to a high actual level of user churn). As a result, we get erroneous predictions. But since we already understand this now, we can proceed to checking the changes in the distribution of the population between the development time (DEV time) and the present time. This will give us a clear idea of whether the model predicted results can be relied on or not. This is exactly what the important PSI and CSI monitoring metrics show.
Population stability index (PSI)
This metric measures how much a variable has changed in distribution between two samples over time. It is widely used to monitor changes in population characteristics and diagnose potential problems with model performance. If the model stops making accurate predictions due to significant changes in population distribution, then this is often a good indicator.
The above definition is best explained in this research paper… I also provided a link to it at the end of this post.
The Population Stability Index (PSI) was originally developed to monitor changes in distribution between ad hoc and development time samples in credit risk assessment. Currently, the use of the PSI index has become more flexible in nature, which allows one to study changes in both distributions associated with model attributes and populations as a whole, including dependent and independent variables CSI… We’ll look at this in the next section.
The PSI reflects the trend towards change in the population as a whole, while the CSI usually focuses on the individual model variables used.

A change in population distribution may be due to:
- with changes in the economic environment, such as the economic crisis, COVID-19, etc .;
- changes in data sources;
- changes in domestic policy that directly or indirectly affect the distribution of the population;
- data integration problems that can lead to data errors;
- problems in programming / coding, such as implementing the model or missing some important steps in the code to evaluate the quality of the model.
Since a change in distribution does not have to be accompanied by a change in the dependent variable, the PSI can also be used to examine the similarity / difference between any samples. For example, to compare the level of education, income and health status of two or more populations in socio-demographic studies.
STEPS FOR CALCULATING THE PSI INDEX (Link)
- We sort the estimated variable in descending order in the estimated sample.
- We divide the data into 10 or 20 groups (decile).
- We calculate the percentage of records in each group based on the estimated sample.
- We calculate the percentage of records in each group based on the development sample.
- Calculate the difference between steps 3 and 4.
- Take the natural logarithm (Step 3 / Step 4).
- Multiply step 5 by step 6.
EXCEL TABLE OF PSI INDEX:
Image courtesy of the author
RULES OF INTERPRETATION (Link)
- PSI Index <0.1 – without changes. You can continue using the existing model.
- PSI index> = 0.1but less than 0.2 – small changes required.
- PSI> = 0.2 – significant changes are required. Ideally, the model should no longer be used. It should be retrained / replaced with another.
You can also use the conditional formatting range – red, yellow and green zones (Red-Amber-Green zone). Red is an alarm condition in which the PSI is more than 20%, yellow is 10-20%, while the model must be monitored, and green is the stage at which the model is considered usable, i.e. < ten%.
Now, based on the use case, these thresholds are adjusted according to the business relevance, but the idea remains the same – to track changes in the population.
Stability Index (CSI)
This characteristic answers the question of which variable causes changes in the distribution of the population. She compares the distribution independent variable in the estimated dataset with the development dataset, and also detects changes in the distribution of input variables that are estimated over time.
This helps to determine which changing variable is primarily causing the model quality metrics to change.
When model performance deteriorates, checking for changes in the distribution of model variables can help identify possible causes. As a rule, this is done after checking, as a result of which it turned out that the PSI index is not in the green zone (<0.1 overall). In this way, you can check which variables mainly determine the distribution of the population. If even one variable has changed significantly, or if the performance of several variables has changed slightly, it may be time to re-train the model or replace it with another. When calculating the CSI, the same steps are taken as when calculating the PSI. The only difference is that the decision is made based on the sample values from design stage for a particular variable (by dividing them into ranges and setting the limits of these values as thresholds). Then, when calculating the frequency values for any validation / unscheduled (OSS) sample, you simply apply the same thresholds to the data and calculate the frequency values (using the same formula we used to calculate the PSI). EXCEL TABLE OF CSI INDEX
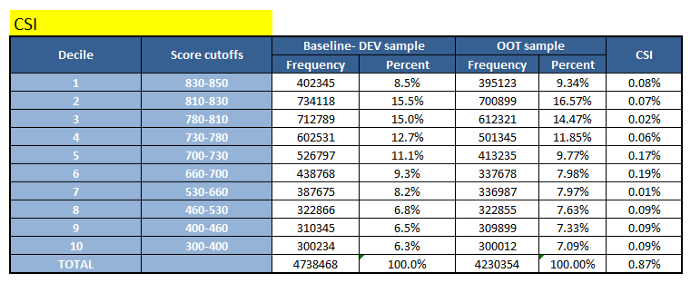
Image courtesy of the author
Thus, the PSI can help identify differences in distributions of populations as a whole, if they are significant, and the CSI can help narrow them down even further to a few responsible variables.