now you can really in prod
We again use a single image to install both versions, yes there are some deployment nuances that those interested can easily find in documentation. But for now, let’s focus on what’s really interesting about the new versions of Visiology.
Visiology 2.31
Let’s start with the second version of the platform. A key innovation in Visiology 2 concerns the evolution of the SmartForms component, which is responsible for data entry. SmartForms has recently become very popular among customers, as it makes it easy to automate the collection of data that was previously provided simply in the format of filled xls-plates. But when the utility becomes popular, it has many users. This means that there should be no conflicts between them.
Previously, when multiple users with the same roles worked in SmartForms, they got access to the fields and elements created by colleagues. And it turned out to be inconvenient when you have several people doing similar work at once, say, in different branches.
If we have Ivanov, the manager of Stavropol (and part-time database operator) and Petrov, the manager of Barnaul (and also a database operator), then before the general role “DB Operator” automatically provided access to all elements.

Now you can turn off permissions on created items in any role, and add any role to exceptions. This approach allows you to more flexibly configure access.

So, if we go under Ivanov and add a new element (line), this line will not be available to Petrov.
Any role can be added to exceptions, which means that the personalization of the work of different users becomes much higher.
Quick Start ViQube
The second plus is an increase in the speed of loading snapshots. This increases the speed of starting the database and the ViQube engine itself. According to our measurements, the system rise time was reduced by an average of 63%, and this is true for both the first and subsequent launches.

New editing method
New Visiology ViQube API methods now allow you to update items by both row number and ID.
Method “update” allows you to update a row in a table:
http(s)://<domain>/viqube/databases/<dbname>/tables/<tblname>/records/updateThis is how it looks like accessing a row by its number in the table

And this is how the call by identifier looks like:

Newsletter
Broadcasting is usually an option for authorized accounts. Accordingly, each recipient must be a specific user. However, it happens that you need to send mail in a closed loop, and we added this feature in Visiology 2.31, and now you can send dashboards and scheduled reports if the mail service is configured without authorization.

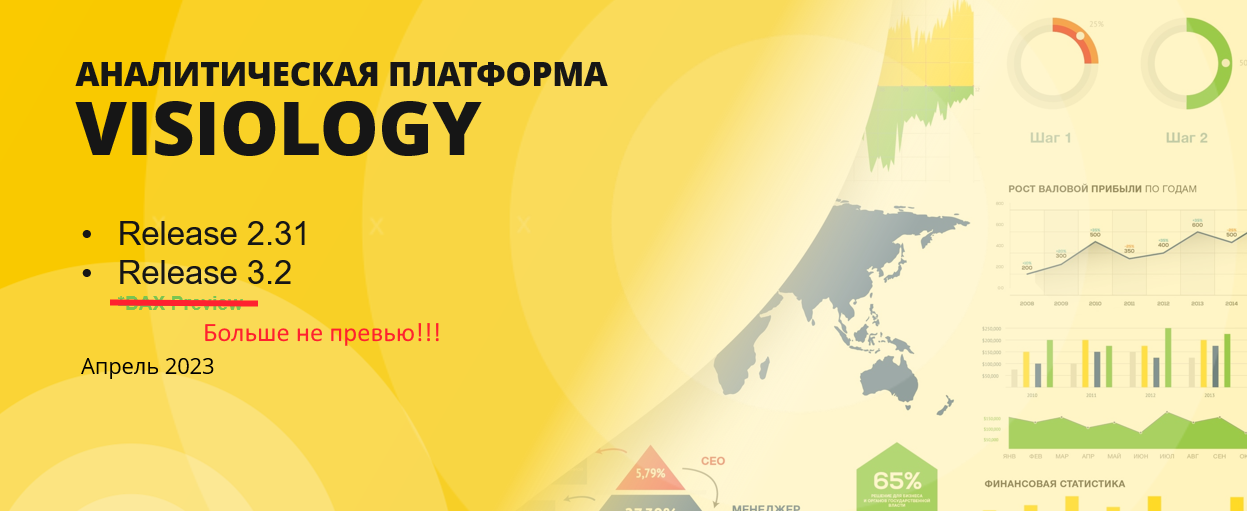
Visiology 3.2
Perhaps the most important thing to say about Visiology 3.2 is that we recommend the platform for production. Among other improvements, we have implemented role-based access control capabilities on the updated platform, and this is in many ways a key feature that is necessary for a full-fledged work.

You can also set up a download schedule. So far only through the API, but in 3.3 this will also be done in the user interface.

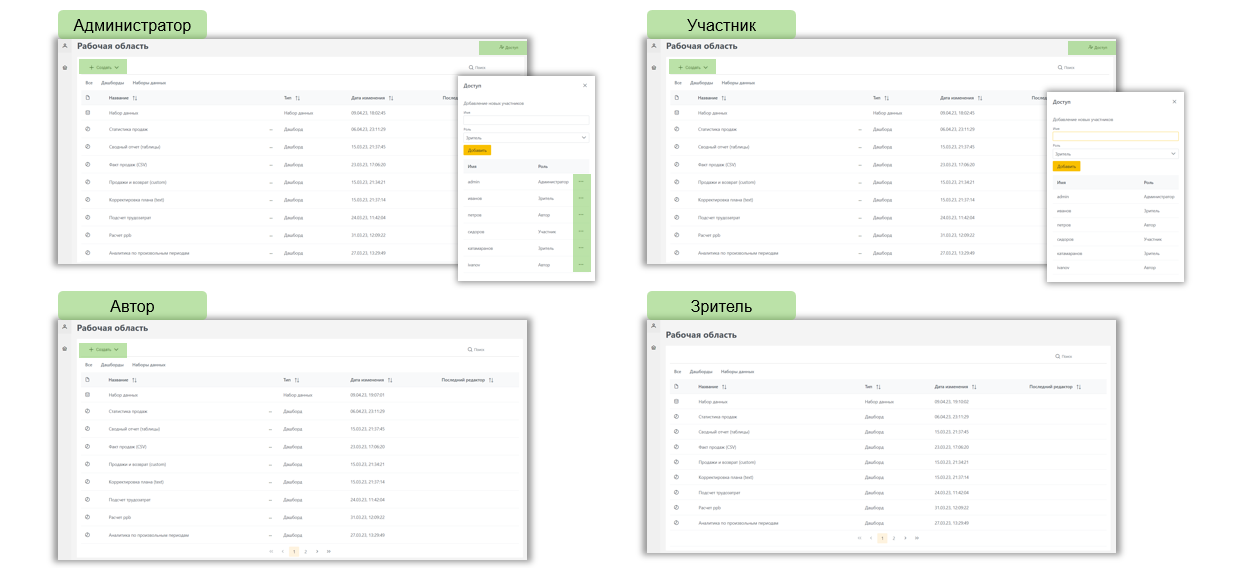
The allocation of rights occurs on the basis of roles. The system has 4 roles:
The administrator fully manages the workspace, including managing users, content, models, dashboards.
A member has the same rights as an administrator, except for deleting users from the workspace and cannot create administrators
Content author – analysts who work with data models, with dashboards. They can perform any manipulations with objects that are entrusted to them.
Viewers are those who can read content but cannot edit it. They can only view dashboards and data models.
Setting rights occurs in several stages. Users must be logged into the system (this process is no different from previous versions). The only caveat is that when upgrading to version 3.2, old users will be deleted – they will have to be created again, but taking into account the role model.

This video shows how users work in the updated interface.
Custom Widgets
Those who have already worked with Visiology 2 are well aware that a custom widget allows you to implement the necessary additional functionality on a dashboard. After adding such a widget, it can be used on any new and old dashboards.

As with standard visualizations, any fields from the model can be added to custom widgets.
This is how creating a new widget looks in the system. The video shows how fields are added, the widget is edited and configured. Everything happens in much the same way as with the default widgets.
New data model – constellation
This is a new data model that allows you to link data from different sources through a single dimension. The most common example is working with a table of sales volume – planned and actual.

Constellation allows you to:
Create new measures based on facts from different sources
Display fact data from different sources on the same widget
Working with the “constellation of facts” looks like this:
The download in this example comes from a CSV file.
Loading from CSV
By the way. Loading from CSV is also a new feature that we have been asked for several times by those who plan to switch to Visiology 3 as soon as possible.

When setting up loading from CSV, you may or may not use headers. If they are in the file, then the first line will be considered headers.
Loading occurs automatically, but you can also reassign fields in the process. This is very convenient for adding additional data with facts from other information sources and systems.
Adding and working with new data from CSV looks like this:
Removing restrictions
Here are some nice improvements:

When fields are selected in the model, they are now also highlighted in the Fields panel on the right (and vice versa). This allows you to quickly find the fields in the model and understand how and with which tables they are related.

Now we can turn off the influence of the selected widget on any widgets within the same sheet. Experienced users of Visiology know that by default, all widgets affect everything. But in Visiology 3.2, you can customize the impact logic other than the default.

Now you can configure the required type of aggregation for indicators on any visualization without the need to create additional measures. Available aggregation types: Sum, Average, Minimum, Maximum, Count

Now you can add custom text to the dashboard. Moreover, you can add not only text, but also values from the data model.

It’s time to prod!
Version Visiology 3.2 differs in a number of those functions that are not tied directly to DAX. This release allowed us to bring the platform closer to the wide capabilities of Visiology 2. Therefore, a number of projects for the product implementation of Visiology 3.2 are already starting, and as far as possible, we will talk about the success of our “early birds”, who among the first began to get acquainted with Visiology 3.0, and now leads pilots and is already transferring part of the analytical expertise to the new platform.
You can learn more about the capabilities of the platform on the website. Visiology.suas well as in information section about current releasesX.