New in SAP PaPM: interface, ML forecasting and scale out
In addition, you need to be able to simulate various forecasts: what will happen if you move sales online or reduce office costs, will IT investments help increase sales by increasing the efficiency of staff. In addition, there are industries where the share of direct costs in the total costs is small, so generally accepted approaches to the distribution of indirect costs can lead to incorrect management decisions.
Typically, as a result of the implementation of advanced cost allocation techniques, it is possible to identify 30-40% of the total cost that can be avoided. This allows you to get additional profit. At the same time, IT costs for allocation systems should provide a quick return on investment, which means that the project implementation period will be short. It is in the analysis and implementation of such complex models that SAP Profitability and Performance Management (formerly SAP FS-PER) helps, which has long ceased to be a solution only for cost management. It is now a rich set of data manipulation and advanced modeling tools. This is confirmed by a variety of scenarios that our customers are now implementing in different industries: manufacturing, media, retail, banks, mining, etc.
Let’s look at the main new features that have appeared in the latest updates to the solution and how you can use ML in SAP PAPM to create forecasts.
1. New interface for modeling and reporting
The new reporting interface contains the ability to build analytics not only by quantitative values and calculation results, but also descriptive analytics. This is useful for many product use cases where extensive documentation is required, such as financial modeling, transfer pricing, sustainability, and tax reporting.
This interface includes WYSIWYG (what-you-see-is-what-you-get) document editorwhich provides text editing to include tables, links, images and videos, and to visualize input and output data.

Server-side what-if modeling
Previously, it was already available to model the results by changing the input parameters, for example, changing the price of incoming material in production or the tariff for servicing a group of customers for the B2C segment, increasing / decreasing IT or fuel costs. The new interface includes modeling of the parameters of the calculation process: period, process, cost center, region, vehicle type, installation type, etc. After completion of the calculation on the server, the results will be reflected in the report.
Client side modeling
Everything is the same as in the server version, only client-side modeling can run scripts based on the data displayed on the report.
Visualization of initial data and calculation results
Input data and results can be visualized using various types of charts and graphs, such as bar, time series, heat maps, value chains, and others. These visualizations are embedded in the report and are interactive. This means that they depend on filters and configurations that allow data granularity. 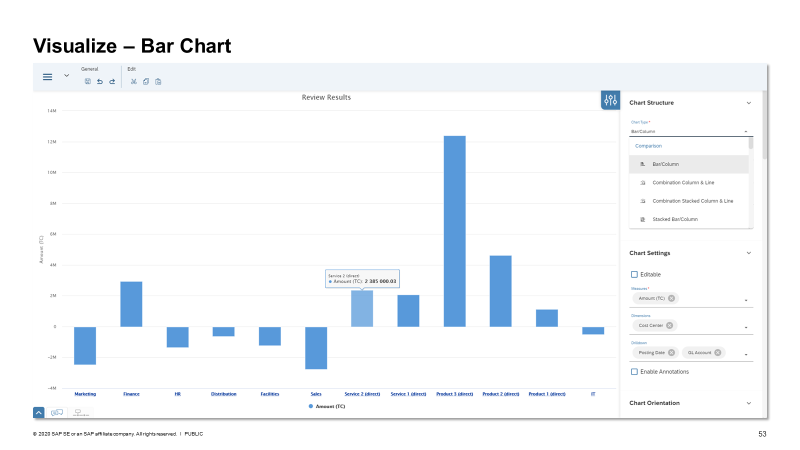
2. Machine learning
New model types “Clustering” and “Classification”, in addition to the already existing “Regression” and “Forecast” (time series), have appeared in the machine learning function using the HANA automated predictive library (APL).

The prerequisite for use is the installed SAP HANA Automated Predictive Library (APL) 1904 (minimum).
Let’s consider an example of using the Forecast rule.
Suppose that we have a task to predict the initial data on the costs of departments for the next year based on data broken down by date, account, cost center, etc.

The forecast period is set to 12. This means that we will get 12 forecast values. The function calculates the values in the Forecast Amount column based on the algorithm applied by APL. The automated library function runs multiple models (such as linear regression or exponential smoothing) on historical data. This is to determine the best model trained on the input dataset. Next, a forecast is built. Predictive values can be used later in other functions.
Thus, the forecast result in our case will look like this.

Machine learning also shows inputs intended for the BEN and COM accounting accounts. The forecast reveals an upward trend for the BEN account and a positive trend for the COM account. Since the period was specified as 12 months, machine learning predicted the amount over the next 12 months for each of the specified account types.
But it often happens that a more detailed forecast or writing your own functions is required. For this, the creation of code in an R script can be used; to call it, SAP HANA R Server must be activated. Further, through the function of calling external procedures Remote Function Adapter, the user can select the type SAP HANA R Script, which allows you to call an external R script. At the same time, PaPM will show the code itself, written externally, or provide an interface for writing and editing it.

This approach can be used for scenarios where complex predictive models are required, for example, in financial modeling or for calculating risks in the banking industry.
3. Parallelization and scale-out
The solution must be able to work with a large amount of data and at the same time provide high performance of calculations, regardless of the scenario. To ensure this, there are more and more opportunities for parallelization of calculations and scale-out functionality. This makes it easier to work with datasets of 2 billion or more records and allows you to actively manage the load on the CPU and RAM.
In the simulation application, by choosing Environment -> Partitioning, you can now define for each partitioning range where this work package should run. This can be useful for achieving even load balancing across the scale-out system landscape. In this case, the number of records in work packages is very uneven, and the SAP HANA automatic distribution is suboptimal.

More details on the settings and subsequent launch can be found here…
In conclusion, I would like to remind you that SAP PaPM comes with standard content to make it easier to get started with the solution. It now has over 40 models for different industries and scenarios from cost allocation to enterprise sustainability analysis. The content is constantly being enriched and replenished, one of the novelties of PCM to PaPM Activity based Costing. It provides a rule editor similar to that of SAP Profitability and Cost Management. And since the solution has run out of support, the new content will significantly simplify the import of rules from SAP PCM, reducing the migration time.
The solution continues to be actively developed, providing users with a whole platform for automating various scenarios through a convenient interface that does not require programming. In the following articles, we will talk about other built-in scenarios that are most in demand among our global and Russian customers, for example, “Sustainability Management” and “IT Cost Allocation” according to the Technology business management methodology.
Author – Irina Sheftelevich, Senior Architect of SAP CIS Business Solutions