ML + HCI: what is being explored at the intersection of machine learning and human-computer interaction
For review, we took the proceedings of the conference CHI: Conference on Human Factors in Computing Systems over 10 years, and with the help of NLP and analysis of social networks, we looked at topics and areas at the intersection of disciplines.

The focus on applied UX design problems is especially strong in Russia. Many of the events that helped the growth of HCI abroad, we did not happen: did not appear iSchools, many specialists who dealt with related aspects of engineering psychology, etc., left science. As a result, the profession arose again, starting from applied tasks and research. One of the results of this is visible even now – this is an extremely low representation of Russian work on HCI at key conferences.
But outside of Russia, HCI has evolved very differently, focusing on many topics and directions. At the master’s program “Information Systems and Human-Computer Interaction”In the St. Petersburg HSE, we are discussing, including with students, colleagues, graduates of similar specialties from European universities, partners who help develop the program, what concerns the field of human-computer interaction. And these discussions show the heterogeneity of the direction in which each specialist has his own, incomplete picture of the area.
From time to time, we hear questions about how this area is related (and whether at all) to machine learning and data analysis. To answer them, we turned to the research of recent years presented at the conference Chi.
First of all, we will tell you what is happening in areas such as xAI and iML (eXplainable Artificial Intelligence and Interpretable Machine Learning) on the part of interfaces and users, as well as how HCI studies the cognitive aspects of the work of data science specialists, and we give examples of interesting works of recent years in each area.
xAI and iML
Machine learning methods are being intensively developed and – which is more important from the point of view of the area under discussion – are actively being introduced into automated decision making. Therefore, researchers are increasingly discussing questions: how do non-machine learning users interact with systems where similar algorithms are used? One of the important issues of this interaction: how to make users trust model-based decisions? Therefore, with each passing year, the topic of interpreted machine learning (Interpretable Machine Learning – iML) and explainable artificial intelligence (eXplainable Artificial Intelligence – XAI) becomes more and more hot.
At the same time, if at conferences such as NeurIPS, ICML, IJCAI, KDD, the algorithms and tools iML and XAI are discussed, several topics related to the design features and experience of using these systems will be in focus on CHI. For example, at CHI-2020 several sections were devoted to this subject at once, including “AI / ML & seeing through the black box” and “Coping with AI: not agAIn!”. But even before the appearance of individual sections, there were quite a lot of such works. We identified four directions in them.
Design of interpreting systems for solving applied problems
The first area is the design of systems based on interpretability algorithms in various applied problems: medical, social, etc. Such works arise in very different fields. For example, work on CHI-2020 CheXplain: Enabling Physicians to Explore and Understand Data-Driven, AI-Enabled Medical Imaging Analysis describes a system that helps doctors examine and explain chest x-ray results. It offers additional textual and visual explanations, as well as pictures with the same and opposite result (supporting and contradictory examples). If the system predicts that a disease is visible on radiography, then it will show two examples. The first, supporting, example is a snapshot of the lungs of another patient who has the same disease. The second, contradictory, example is a picture in which there is no disease, that is, a picture of the lungs of a healthy person. The main idea is to reduce obvious errors and reduce the number of calls to third-party specialists in simple cases in order to make a diagnosis faster.
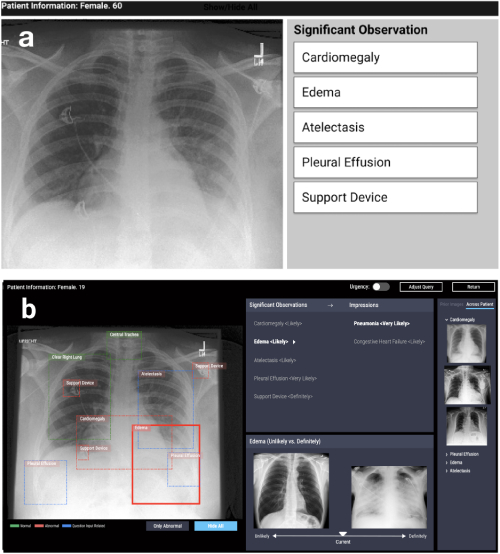
CheXpert: automated area selection + examples (unlikely vs definitely)
Development of systems for the study of machine learning models
The second direction is the development of systems that help interactively compare or combine several methods and algorithms. For example, at work Silva: Interactively Assessing Machine Learning Fairness Using Causality At CHI-2020, a system was introduced that builds several machine learning models on user data and provides the possibility of their subsequent analysis. The analysis includes constructing a causal graph between the variables and calculating a series of metrics that evaluate not only the accuracy but also the fairness of the model (Statistical Parity Difference, Equal Opportunity Difference, Average Odds Difference, Disparate Impact, Theil Index), which helps to find distortions in the predictions.

Silva: graph of relationships between variables + graphs for comparing honesty metrics + color highlighting of influential variables in each group
General Model Interpretability Issues
The third area is a discussion of approaches to the problem of interpretability of models in general. Most often these are reviews, criticisms of approaches and open questions: for example, what is meant by “interpretability”. Here I would like to note a review at CHI-2018 Trends and Trajectories for Explainable, Accountable and Intelligible Systems: An HCI Research Agenda, in which the authors examined 289 major works devoted to explanations in artificial intelligence, and 12,412 publications citing them. Using network analysis and thematic modeling, they identified four key research areas: 1) Intelligent and Ambient (I&A) Systems, 2) Explainable AI: Fair, Accountable, and Transparent (FAT) algorithms and Interpretable Machine Learning (iML), 3) Theories of Explanations: Causality & Cognitive Psychology, 4) Interactivity and Learnability. In addition, the authors described the main research trends: interactive learning and interaction with the system.
User research
Finally, the fourth direction is user research of algorithms and systems that interpret machine learning models. In other words, this is research on whether new systems become more understandable and transparent in practice, what difficulties users experience when working with interpretive rather than original models, how to determine whether the system is used as planned (or found a new application for it – maybe incorrect), what are the needs of users and do developers offer them what they really need.
A lot of tools and interpretation algorithms have appeared, so the question arises: how to understand which algorithm to choose? In work Questioning the AI: Informing Design Practices for Explainable AI User Experiences just discusses the issues of motivation for using explanatory algorithms and identifies problems that, with all the variety of methods, have not yet been sufficiently resolved. The authors come to an unexpected conclusion: most of the existing methods are designed so that they answer the question “why” (“why I have such a result”), while users also need to answer the question “why not” (“why not another “), and sometimes -” what to do so that the result changes. ”
The work also says that users need to understand what the limits of applicability of methods are, what limitations they have – and this must be explicitly implemented in the proposed tools. This problem is shown more clearly in the article. Interpreting Interpretability: Understanding Data Scientists’ Use of Interpretability Tools for Machine Learning. The authors conducted a small experiment with specialists in the field of machine learning: they showed them the results of several popular tools for interpreting machine learning models and offered to answer questions related to making decisions based on these results. It turned out that even experts too trust such models and do not take results critically. Like any tool, explanatory models can be used incorrectly. When developing tools, it is important to take this into account, attracting the accumulated knowledge (or specialists) in the field of human-computer interaction in order to take into account the features and needs of potential users.
Data Science, Notebooks, Visualization
Another interesting area of HCI is the analysis of the cognitive aspects of working with data. Recently, a question has been raised in science about how the “degrees of freedom” of a researcher — especially the data collection, design of experiments, and the choice of analysis methods — affect the results of research and their reproducibility. Although the bulk of the discussion and criticism is related to psychology and the social sciences, many problems relate to the reliability of findings in the work of data analysts in general, as well as the difficulties in delivering these findings to consumers of analysis.
Therefore, the subject of this HCI area is the development of new methods for visualizing uncertainty in model predictions, creating systems for comparing analysis performed in different ways, and also analyzing the work of analysts with tools, for example, Jupyter notebooks.
Visualization of uncertainty
Visualization of uncertainty is one of the features that distinguish scientific graphics from presentation and business visualization. For quite some time, the principle of minimalism and focus on the main trends was considered key in the latter. However, this leads to an overconfidence of users in a point estimate of the value or forecast, which can be critical, especially if we must compare forecasts with varying degrees of uncertainty. Job Uncertainty Displays Using Quantile Dotplots or CDFs Improve Transit Decision-Making analyzes how visualization methods for prediction uncertainty for scatter plots and cumulative distribution functions help users make more rational decisions using the mobile app as an example of estimating the time of bus arrival. What is especially nice, one of the authors supports ggdist package for R with various variance visualization options.

Examples of visualization of uncertainty (https://mjskay.github.io/ggdist/)
However, tasks of visualizing possible alternatives are often encountered, for example, for sequences of user actions in web analytics or application analytics. Job Visualizing Uncertainty and Alternatives in Event Sequence Predictions analyzes how graphically presenting alternatives based on the Time-Aware Recurrent Neural Network (TRNN) model helps experts make decisions and trust them.
Model Comparison
No less important than the visualization of uncertainty, an aspect of the work of analysts – a comparison of how – often hidden – the researcher’s choice of different approaches to modeling at all its stages can lead to different analysis results. In psychology and the social sciences, pre-registration of research design and a clear separation of exploratory and confirmatory studies are gaining popularity. However, in tasks where the study is more based on data, an alternative may be tools to assess the hidden risks of analysis by comparing models. Job Increasing the Transparency of Research Papers with Explorable Multiverse Analyzes suggests using interactive visualization of several approaches to analysis in articles. In essence, the article turns into an interactive application where the reader can evaluate what will change in the results and conclusions if a different approach is applied. This seems like a useful idea for practical analytics.
Work with tools for organizing and analyzing data
The final block of work is about researching how analysts work with systems like Jupyter Notebooks, which have become a popular tool for organizing data analysis. Article Exploration and Explanation in Computational Notebooks analyzes the contradictions between research and explanatory goals, studying the interactive documents found on Github, and in Managing Messes in Computational Notebooks authors analyze how notes, parts of code and visualizations evolve in the iterative process of analysts’ work, and suggest possible additions to tools to support this process. Finally, already at CHI 2020, the main problems of analysts at all stages of work, from downloading data to transferring the model to production, as well as ideas for improving tools are summarized in the article What’s Wrong with Computational Notebooks? Pain Points, Needs, and Design Opportunities.
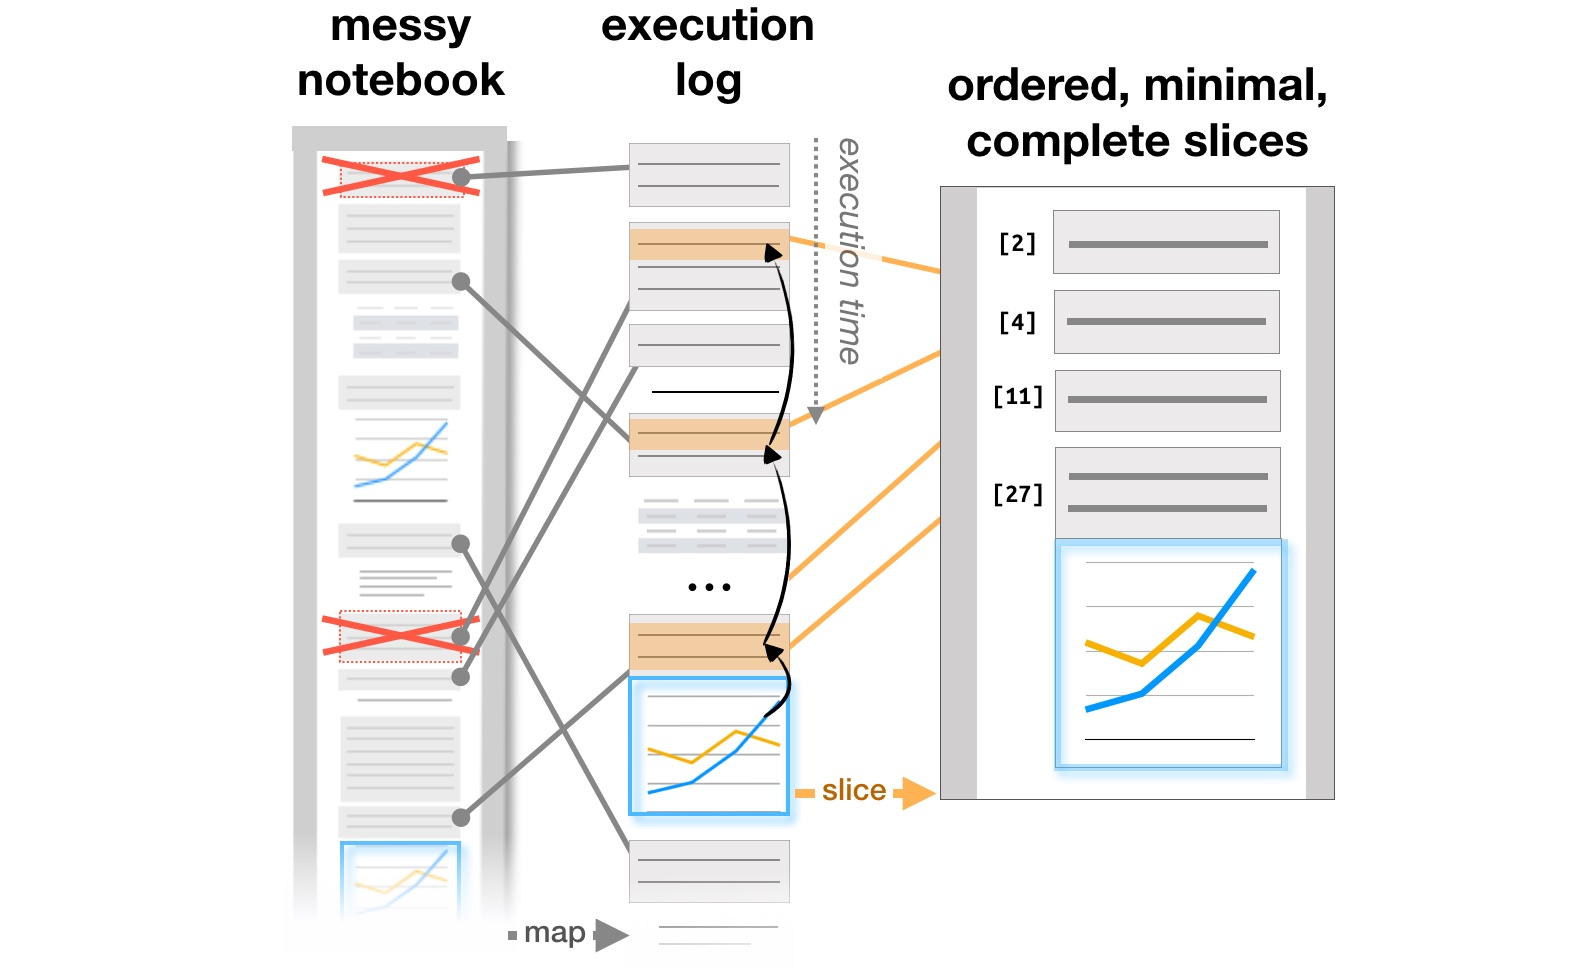
Transformation of the report structure based on the execution logs (https://microsoft.github.io/gather/)
Summarizing
Concluding part of the discussion “What is HCI doing” and “why does a HCI specialist know machine learning”, I would like to once again note the general conclusion from the motivation and results of these studies. As soon as a person appears in the system, this immediately leads to a number of additional questions: how to simplify interaction with the system and avoid errors, how the user changes the system, does the actual use differ from the planned one. As a result, we need those who understand how the process of designing systems with artificial intelligence works and know how to take into account the human factor.
We teach all this at the master’s program “Information systems and human-computer interaction“. If you are interested in research in the field of HCI – look at the light (now just started reception campaign) Or follow our blog: we’ll talk about projects that students worked on this year.