medium load Kubernetes or a simple list query?
In this article, we will describe how we encountered multiple requests to the Kubernetes API server from one of the applications, what this led to and how the problem was solved.

background
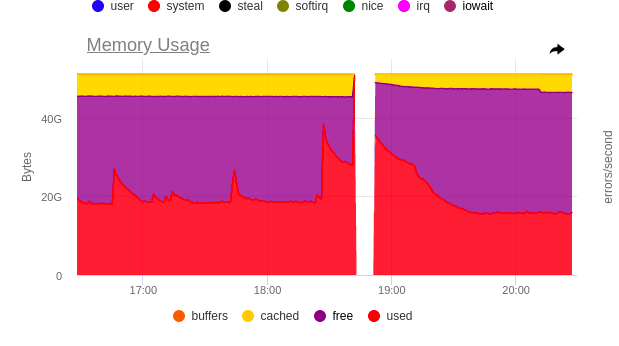
The evening promised to be languid. However, once again rebooting kube-apiserver, we got an almost threefold increase in etcd memory consumption. Explosive growth led to a cascading reboot of all master nodes. It was impossible to leave a production client in such danger.


Having studied aidit logswe realized that one of our DaemonSets was to blame, whose Pods, when kube-apiserver was rebooted, started sending list requests to it again in order to fill their caches with objects (standard behavior for infromers from Kubernetes client-go).
The scale of the problem was as follows: each Pod made 60 list requests at startup, and the total number of nodes in the cluster was ~80.
Understanding etcd

The request sent by the Pods of our application looked like this:
/api/v1/pods?fieldSelector=spec.nodeName=$NODE_NAMEOr, in Russian, “show me all the Pods that are on the same node with me.” In our understanding, the number of returned objects should not exceed 110, but from the point of view of etcd, this is not entirely true.
{
  "level": "warn",
  "ts": "2023-03-23T16:52:48.646Z",
  "caller": "etcdserver/util.go:166",
  "msg": "apply request took too long",
  "took": "130.768157ms",
  "expected-duration": "100ms",
  "prefix": "read-only range ",
  "request": "key:\"/registry/pods/\" range_end:\"/registry/pods0\" ",
  "response": "range_response_count:7130 size:13313287"
}
It is seen above that range_response_count is 7130. But we asked for 110! Why is that? The fact is that etcd is a very simple database that stores all data in the format “key: value“. In this case, all keys are formed according to the template /registry/<kind>/<namespace>/<name>. About any field– And labelbase does not know selectors. Therefore, in order to return our 110 Pods, kube-apiserver must get all (!) Pods from etcd.
At this point, it became clear that despite efficient requests to kube-apiserver, applications still generated an incredible load on etcd. So maybe there is a way in some cases to avoid queries to the database?
resource version
The way we mentioned first is to specify resourceVersion as query parameters. Every object in Kubernetes has a version that increments every time the object changes. Let’s use this property.
Actually, there are two parameters: resourceVersion and resourceVersionMatch. How exactly to twist them, with details and clever language is described in the Kubernetes documentation. So let’s focus on which version of the object we can end up with.
Most recent version (MostRecent) is the default version. If no options are specified, we get the latest version of the object. To make sure it’s the MOST recent version, you should ALWAYS query etcd.
Any version (any) – if we asked to return to us a version no older than “0”, then we will get the version that is in the cache of kube-apiserver. In this case, we only need etcd when the cache is empty.
An important point: if you have more than one instance of kube-apiserver, then there is a risk of getting different data when making requests to different kube-apiserver.
Version no older than (NotOlderThan) – requires specifying a specific version, so we cannot use this when starting the application. The request goes to etcd if the appropriate version is not in the cache.
Exact version (Exact) – the same as NotOlderThan, only requests get to etcd more often.

If your controller cares about the accuracy of the received data, then the default settings (MostRecent) suit you. But for individual components, for example, a monitoring system, extreme accuracy can be sacrificed. There is a similar option in kube-state-metrics.
Solution found. We check.
# kubectl get  --raw '/api/v1/pods' -v=7 2>&1 | grep 'Response Status'
I0323 21:17:09.601002  160757 round_trippers.go:457] Response Status: 200 OK in 337 milliseconds

# kubectl get  --raw '/api/v1/pods?resourceVersion=0&resourceVersionMatch=NotOlderThan' -v=7 2>&1 | grep 'Response Status'
I0323 21:17:11.630144  160944 round_trippers.go:457] Response Status: 200 OK in 117 milliseconds
In etcd we see only one request, which lasts 100 milliseconds.
{
  "level": "warn",
  "ts": "2023-03-23T21:17:09.846Z",
  "caller": "etcdserver/util.go:166",
  "msg": "apply request took too long",
  "took": "130.768157ms",
  "expected-duration": "100ms",
  "prefix": "read-only range ",
  "request": "key:\"/registry/pods/\" range_end:\"/registry/pods0\" ",
  "response": "range_response_count:7130 size:13313287"
}
Works! But what could go wrong? Our application was written in Rust, and in the library for working with Kubernetes there is simply no resource version setting for Rust parameters!
Deep down we are sad, make a note in the future to send a pull request to the developers of this library and go look for another solution (by the way, pull request We didn’t forget to send.
Slow down to speed up
But there was another feature that caught my eye: the sequential roll of Pods did not affect the consumption graphs in any way, only a simultaneous restart could be seen there. What if we could somehow queue all requests to kube-apiserver and prevent our applications from killing it? So we really can do it.

For this, we turn to API Priority & Fairness. Details about all the nuances can be found in the documentation – we are not up to it, we need to fix the accident. Let’s dwell on the most important thing: how to line up all requests in a queue.
To do this, you need to create two manifests:
apiVersion: flowcontrol.apiserver.k8s.io/v1beta1
kind: PriorityLevelConfiguration
metadata:
  name: limit-list-custom
spec:
  type: Limited
  limited:
    assuredConcurrencyShares: 5
    limitResponse:
      queuing:
        handSize: 4
        queueLengthLimit: 50
        queues: 16
      type: Queue
PriorityLevelConfiguration in a simple way we will call “queue settings”. They are standard and copied from the documentation. The main problem here is that the settings of one queue affect the operation of other queues, and you can understand how many parallel requests you are given only after applying the resource or complex mathematical calculations in your mind.
apiVersion: flowcontrol.apiserver.k8s.io/v1beta1
kind: FlowSchema
metadata:
  name: limit-list-custom
spec:
  priorityLevelConfiguration:
    name: limit-list-custom
  distinguisherMethod:
    type: ByUser
  rules:
  - resourceRules:
    - apiGroups: [""]
      clusterScope: true
      namespaces: ["*"]
      resources: ["pods"]
      verbs: ["list", "get"]
    subjects:
    - kind: ServiceAccount
      serviceAccount:
        name: ***
        namespace: ***
FlowSchema answers the questions “What? By whom? Where? ”, Or whose requests for which resources to send to which queue.
We apply both in the hope of success and look at the graphs.

Great! There are still bursts, but you can already go to sleep. We are processing the incident, the criticality has been removed.
Afterword
That DaemonSet was the log collector vector, which uses data about Pods to enrich the logs with meta-information. The issue was resolved within PR opened by us.
Not only Pod requests are potentially dangerous. Later we found the same problem inside CNI cilium – and solved it in a well-known, proven way.
Such nuances in the operation of Kubernetes often arise during operation. One of the effective ways to solve this problem is to use a platform in which this and many other cases are worked out by default. For example, Deckhouse.
PS
Read also on our blog:


