How we made the Dropbox Android app launch 30% faster

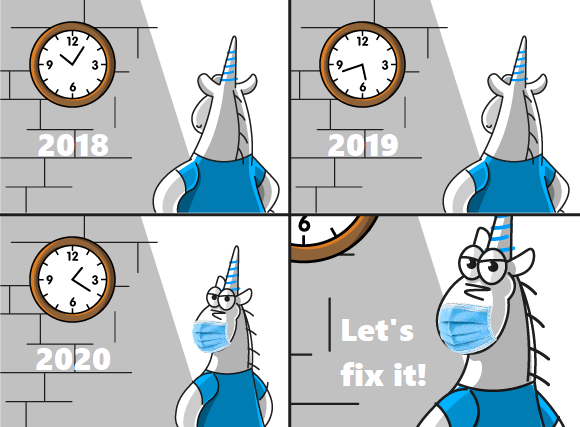
Launching the application is the first impression of our users after installing the application. This is what happens every time. Simple and fast, it is much more fun for users than an app that has tons of features but takes forever to get up and running. The Dropbox Android team has put the time and effort into measuring, identifying and fixing issues affecting app launch times. As a result, we reduced the launch time of the application by 30%, and here is the story of how we did it.
Terrible rise
Historically, at Dropbox, we’ve tracked the launch of an app by measuring how long it took from the moment the user clicked on our app icon to the moment the app was fully loaded and ready for the user. We’ve abstracted the application initialization dimensions like this:
perfMonitor.startScenario(AppColdLaunchScenario.INSTANCE)

// perform the work needed for launching the application

perfMonitor.stopScenario(AppColdLaunchScenario.INSTANCE)
As a data-driven team, we tracked and controlled the initialization of the application with graphs that all engineers could see. The graph below shows measurements of the 90th percentile when launching the app between late March and early April 2020.
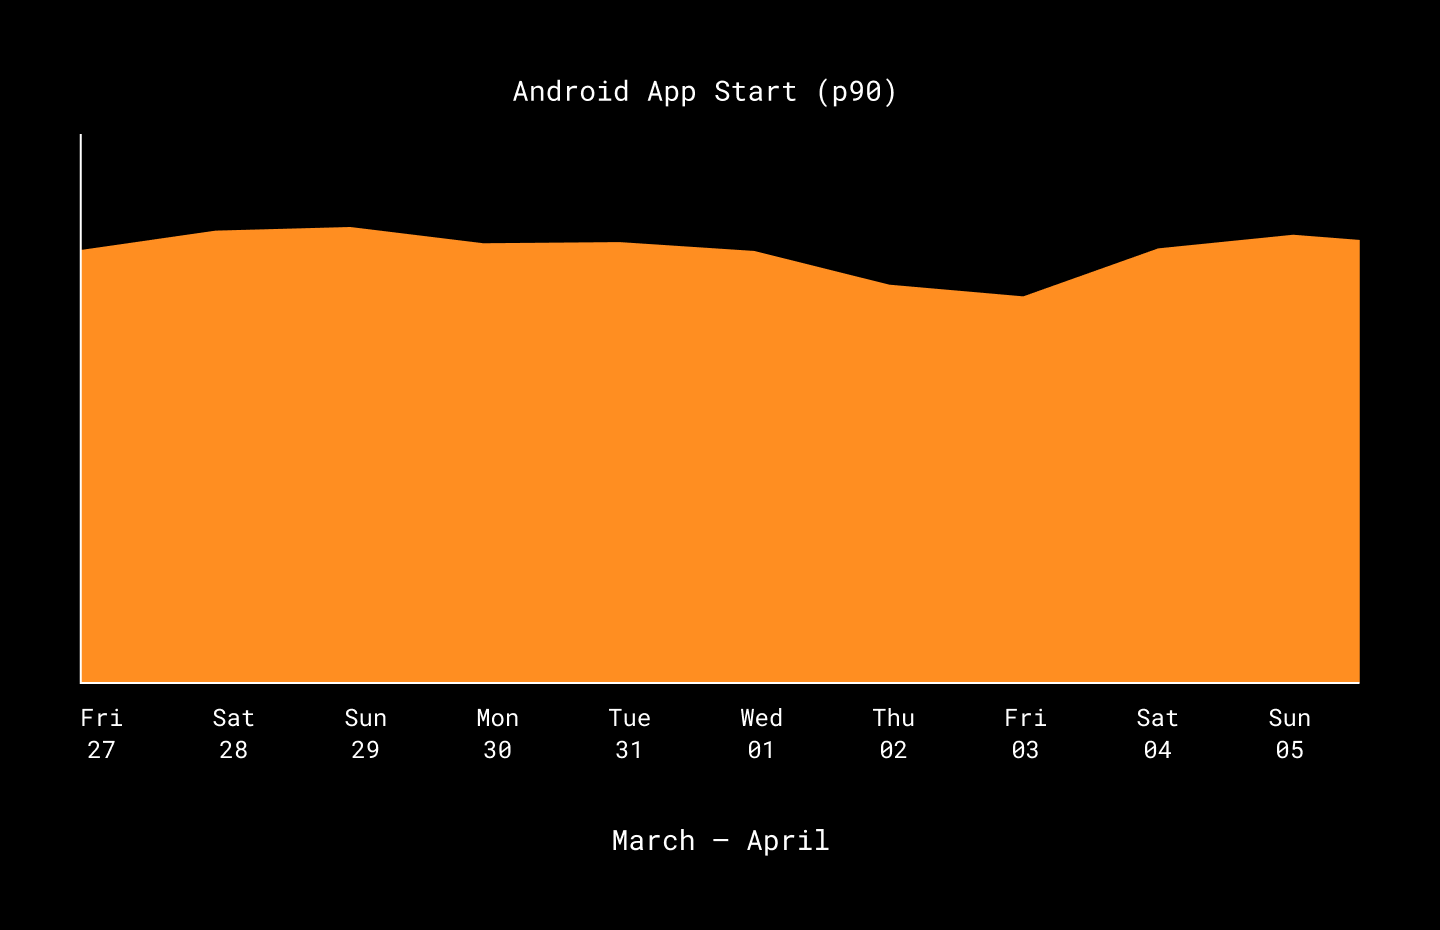
As you can see in the graph, the startup time of the app doesn’t seem to change that much. Small fluctuations in application launch, which vary within a couple of milliseconds, are expected in an application that millions of users – across a wide variety of devices and operating systems – use.
However, when we looked at the launch times of the app from December 2019 to April 2020, we saw a different picture. Launch times have been creeping upward for several months as we develop and add functionality. However, since the graphs only showed us the changes that occurred in two weeks, we missed the slow increase in launch times that took place over several months rather than two weeks.

While we discovered slow-rising startup times by accident, the slowdown forced us to delve deeper into its causes to ensure that our monitoring, alerting, and graphing tools provide a broad and holistic view of metrics.
More numbers
Some features of the application are measured relatively simply, such as how long it takes to call the server API. Other features, such as launching an application, are much more difficult to measure. Before the user is shown the main screen of the application and it is ready to interact with the user, many different actions are required. After examining the initialization code, we have identified the main events that occur during initialization. Here are a few of them:
-
Performing migration.
-
Loading application services.
-
Loading the first users.
We started our research with profiling in Android Studio to measure the performance of our test phones. The problem with profiling performance with this approach was that the test phones did not provide a statistically significant sample of how well the application launch actually performed. The Dropbox Android app has over 1 billion installs on the Google Play Storecovers several types of devices, some are older Nexus 5s, others are the newest, best Google devices. It would be foolish to try to profile so many configurations. Therefore, we decided to measure the performance of different stages of application launch using a step-by-step scenario in a production environment.
Here is the updated initialization code where we added logging for the three steps mentioned above:
perfMonitor.startScenario(AppColdLaunchScenario.INSTANCE)
perfMonitor.startRecordStep(RunMigrationsStep.INSTANCE)

// perform migrations step wrok

perfMonitor.startRecordStep(LoadAppServicesStep.INSTANCE)

// load application services step

perfMonitor.startRecordStep(LoadInitialUsers.INSTANCE)

// perform initial user loading step

perfMonitor.stopScenario(AppColdLaunchScenario.INSTANCE)
By measuring through the code, we were able to understand which stages of application initialization are slowing down the application the most.
We found the culprit
The graph below shows the total app launch time from January to October 2020.

In May, we started measuring all the milestones for initializing an application. These measurements allowed us to identify and eliminate the main culprit behind the slowdown in application launch.
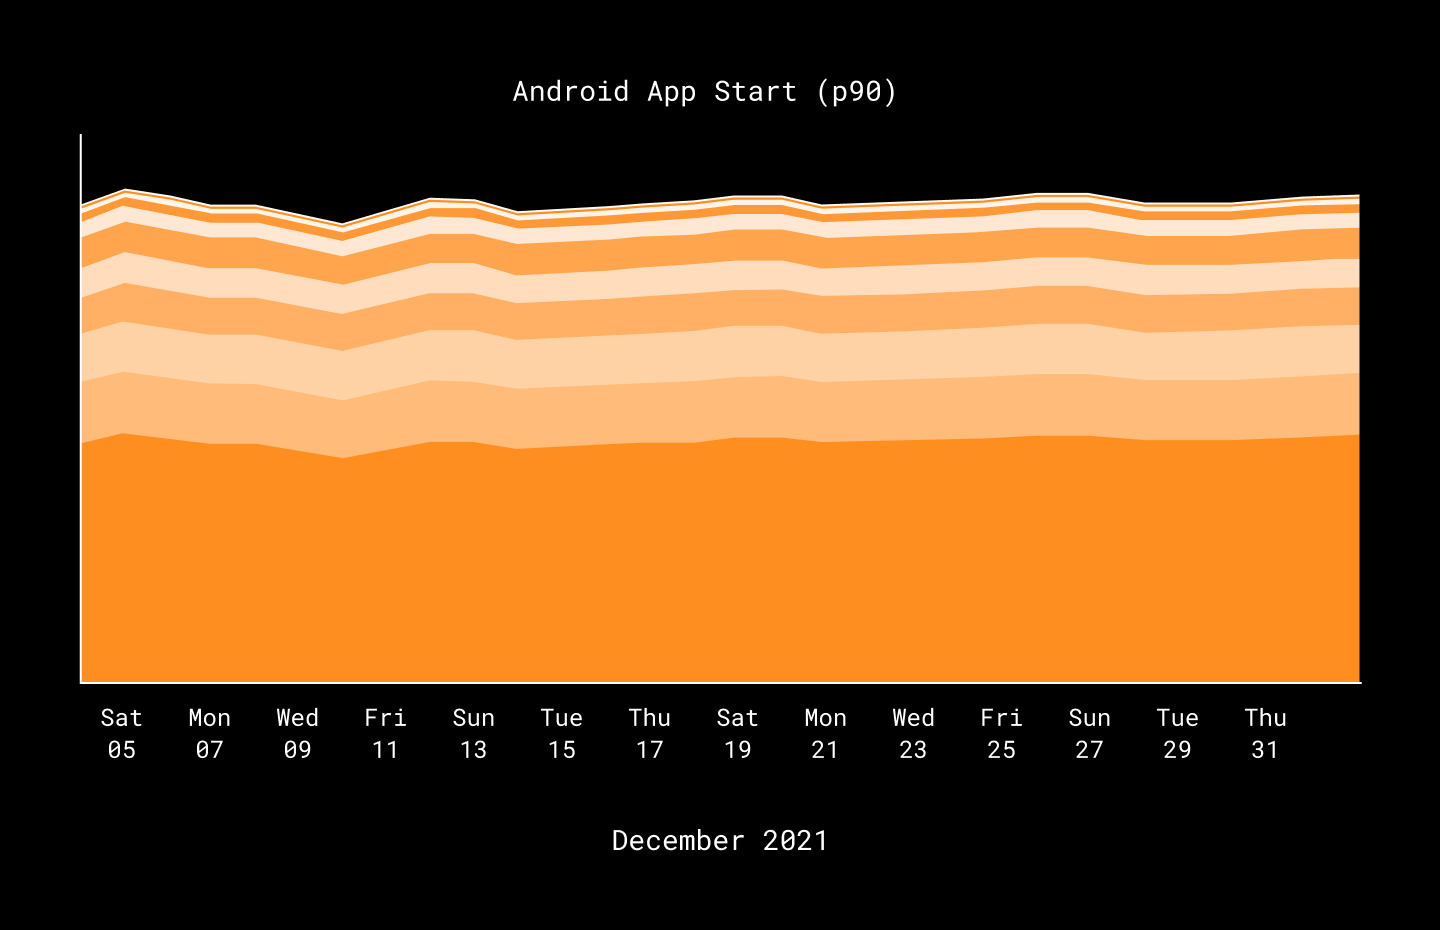
The performance issues were to blame for the initialization of the Firebase Performance library, migration of functionality flags, and user initialization.
Firebase Performance Library
To measure and report application performance metrics, the Firebase Performance Library is included in Google Firebase. It provides useful functionality: performance metrics for individual methods, and infrastructure for monitoring and visualizing the performance of different parts of an application. Unfortunately, the Firebase performance library also has some hidden costs. Among them is an expensive initialization process and, as a result, a significant increase in build time. On debugging, we found that the Firebase Suite initialization took seven times longer when the Firebase Performance tool was enabled.
To fix the performance issue, we decided to remove the Firebase Performance tool from the Android Dropbox app. The Firebase Performance library is a great tool that allows you to profile very low-level performance details such as individual function calls, but since we did not use these library capabilities, we decided that fast application launch is more important than performance data for individual methods, and therefore removed the link to this library.
Migrations
There are several internal migrations that run every time the Dropbox app is launched. These can include updating feature flags, migrating databases, and so on. Unfortunately, we found that some of these migrations ran every time the application was started. Previously, we did not notice their poor performance, because the application quickly launched on development and test devices. Unfortunately, this migration code worked especially badly on older OS versions and older devices, which contributed to increased startup times.
To solve this problem, we started by examining which migrations were required on every launch, and which could be completely removed from the application. Returning load times, we found and removed at least one very old and therefore unnecessary migration.
User loading
We store the contact metadata of Dropbox users on the device as JSON blobs – a legacy part of the app. Ideally, these blobs should only be read and converted to Java objects once. Unfortunately, the user fetch code was called multiple times from various legacy functions in the application, and each time that code performed expensive JSON parsing to convert custom JSON objects to Java objects. Storing user contacts in JSON format as such was an outdated solution in architecture and it was part of the legacy monolith. To address this issue immediately, we added functionality to cache parsed custom objects during initialization. As we continue to break down the legacy monolith, a more efficient and modern solution for storing user contacts would be to use Room database objects and convert those objects to business objects.
What is being done now?
As a result of the removal of the Firebase Performance link and costly migration steps, as well as caching user downloads, we have increased the launch performance of Dropbox Android apps by 30%. Thanks to this work, we have also put together dashboards to help prevent degradation of application launch times in the future.
We have adopted several methods that will hopefully prevent us from repeating performance mistakes. Here are a couple of them:
We look at what happens to performance when we add third party libraries.
After discovering how much the Firebase Performance library slowed down our application launching, we introduced adding third-party libraries as a process. Today, before a library can be added and used in our codebase, we need to measure startup time, build time, and application APK size.
We cache everything…
Since the two main culprits for performance drops when launching applications were related to caching, we now prefer to cache expensive computations, even if the code gets a little more complex. In the end, the best user experience is worth the extra service.
Conclusion
By investing more in persuasive analytics and performance measurements, the team is now even bigger data-driven which helps us to invest in the codebase like remove obsolete C ++ code much more confident. Today we’re following a few dashboards that give us insight into the performance of the most important parts of our apps, and we have processes that keep the Dropbox app agile to keep users happy.

Find out the detailshow to get a Level Up in skills and salary or an in-demand profession from scratch by taking SkillFactory online courses with a 40% discount and a promotional code HABR, which will give another + 10% discount on training.
Other professions and courses
PROFESSION
COURSES