How to make a GUI Data Science Windows (and non-Windows) application using PySimpleGUI
- The ML model is tested on various datasets. You can drag CSV files into the model and draw the AUS / ROC curve. This is where the GUI works great, right?
- Build a random variable or statistical distribution in a given range and dynamically manage parameters using a graphical interface.
- Quickly start some data processing or preprocessing tasks in a dataset using the GUI instead of writing a bunch of code.
In this article, we’ll show you how to create such a graphical interface with a minimum of effort learning the Python library.

What is PySimpleGUI?
There are some very popular GUI frameworks in the Python ecosystem like Tkinter, PyQt, etc. But they are often somewhat bloated and difficult to learn for data scientists who might want to write a simple application with a minimum of code rather than wasting time. for the development of a large program with a graphical interface at the enterprise level.
Easy-to-learn wrapper
The PySimpleGUI website says: “Python GUI for humans – transforms Tkinter, Qt, Remi, WxPython into portable Pythonic interfaces that are human friendly“. Basically, this GUI framework takes all of these popular and well-established GUI frameworks and wraps them into a single library that is easy to learn and then build applications. You don’t even need to write a class definition to create a GUI application! Data scientists often lack development experience. They can greatly benefit from learning and using a tool that allows them to build small, targeted GUI applications for exploring data, analyzing it, experimenting with ML models, etc. So I created a repository to populate with short, targeted scripts. which create desktop applications when launched. This repository… There are already some good tutorials on the net about PySimpleGUI. In my repository, I focus on building simple demos related to data science (simple analytics, statistical modeling, visualizations, and basic machine learning) using this powerful GUI building tool.
Benefits of the wrapper
- No callbacks needed.
- To reduce the amount of code, Python constructs are used. For example, a widget is configured right where it should be, rather than a few lines of code from that location.
- Depends on one package: wraps around Tkinter and does not require other packages to be installed.
- The same GUI program can run on multiple platforms, including a web browser, without changing the source code except for the import statement.
- It is possible to develop an interface for several OS platforms – Windows, Linux, Raspberry Pi and Android (PyDroid3) – with very minor changes.
Basically, you can start building working (and useful) GUI applications with a basic knowledge of Python and you can get it done in a day.
Application examples
Install the library like this: pip install pysimplegui… To run the examples, you will also need these libraries:
- Numpy.
- Pandas.
- Matplotlib.
- Scikit-learn.
- Seaborn.
Data Science “Hello World”
The simplest program in PySimpleGUI will display the line Hello world in a small window. But, in the spirit of DS, let’s make our introductory program more interesting and useful! Here script… Let’s call it GenRandom.py…

Change to the directory with this script, run the command python GenRandom.py… You will see a simple pop-up window where you can click a button to invoke the update function (see code above) to generate a random number between 1 and 99.
While this is a very simple scenario, it includes:
- layout (with style arguments like
sizeandfont) and window; - a button element that calls an external function (event);
- a function to update a text element in a window object.
Basically, to create powerful data analytics applications, we can follow the same path and add more layers of layout, events, logic, and widgets.
Other widgets
Here’s another scenario to illustrate other widgets. Just run the command:
python FontUpdate.pyYou will see a pop-up window where you can dynamically update the text font. Here’s a demo video:

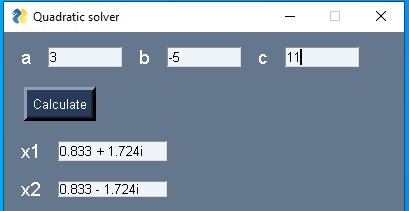
Equation solver
Run the python QuadraticEquation.py command and you will see a pop-up window where you can enter the coefficients of the quadratic equation to solve it (even if the roots turn out to be complex numbers!).
Pandas DataFrame Parser
In this example, we show how easy it is to create a GUI that interacts with a widely used object such as a Pandas DataFrame. As usual, you run script python SimpleDataFrame.py command. First, it will ask you for a dataset file (CSV).
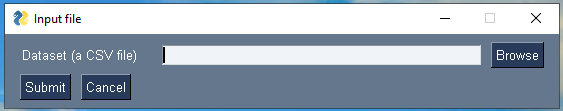
When you click on the Browse button, the file browser dialog will first appear. Make sure to select a dataset that is appropriate for this demo.

After selection cars.csv other requests will appear:
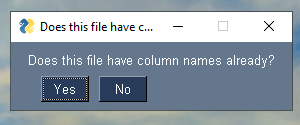

If you click Yes on the last prompt, you will see the dataset read in a new window:

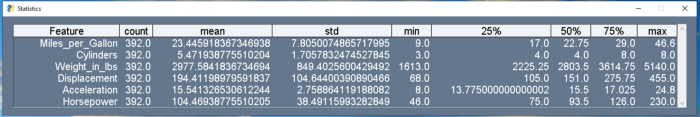
After closing this window, a new pop-up window will appear asking if you want to see descriptive statistics for this dataset. If you click Yes, you will see something like this:
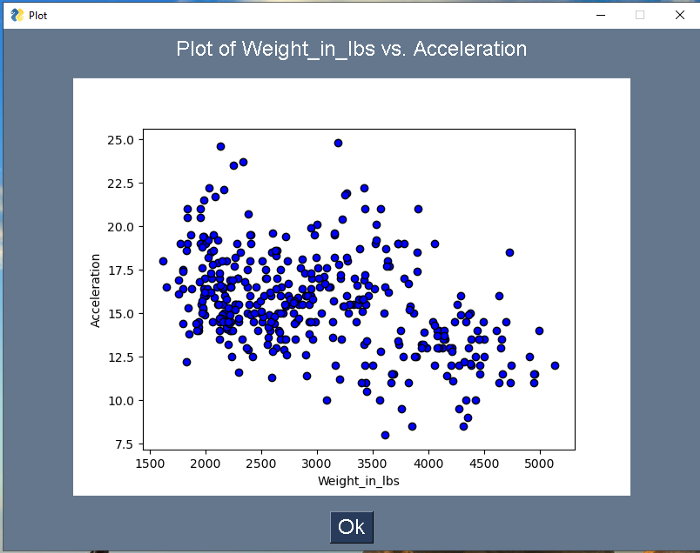
After closing this window, another pop-up window will ask if you want to see an example graph. If you click Yes, you will see something like this:
Random scatter plot generator
This application is intended to demonstrate the ability to create dynamic graphs that interact with the user. The script lies here… When you run it, a window appears with a simple button that you can press as many times as you want, generating a random scatter plot each time. Under the hood, of course, is Numpy and Matplotlib.
Curve Fitting Application
DS specialists and analysts always fit curves or analytic functions to some data. It’s easy to create a simple application where you can demonstrate this with PySimpleGUI.
Core Is a script. At startup, a window appears with buttons for generating and setting the polynomial function of the 2nd degree. Moreover, we also set a small slider to adjust the level of Gaussian noise that is added to the data. Briefly, this example shows how basic data mining functions are integrated into a lightweight graphical interface:
Scikit-learn model training example
Finally we come down to an example of a real ML. We will show you how to build a simple application to load a dataset Pima Indians diabetes and train a Random Forest model on this data using Scikit-learn in the background. The script lies here… The figure below shows the operation of this program with a graphical interface. Note that it covers the standard processes expected from a machine learning program:
- loading a dataset;
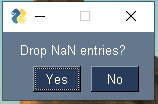
- options to reset NaN values and indicate whether the columns have headers;
- displaying a dataset;
- displaying descriptive statistics;
- selecting an output column from a list that is automatically filled when the dataset is loaded;
- simple error checking for the output column;
- running the classification algorithm in the background and displaying the accuracy in the GUI:
Summary
We have described a simple and powerful Python library for building GUI programs and discussed its advantages over more established libraries. Many great GUI programming tutorials have already been written in Python, but in this article we have shown oriented examples related to data science and mathematical programming, with an aspect that traditional textbooks lack. Here is the library’s official “recipe book”.
Cookbook – PySimpleGUI not so long ago returned the word Cookbook to the title, so the outdated documentation pysimplegui.readthedocs.io was used.
In this article, we have shown examples from the list below:
- different types of widgets for management;
- data input and output – reading files and generating graphs;
- traditional DS libraries: Numpy, Pandas, Matplotlib, and Scikit-learn.
Obviously, these examples can be used to build many more intuitive GUI applications for working with data. I plan to keep adding examples like this to my repository on Github, you can fork them or mark them with an asterisk if you like. Look at my repositories, there is not only code, but ideas and resources on ML and Data Science.
And if you want to study ML and Data Science – come to us, it will be difficult but interesting. A promo code HABRadding 10% to the banner discount will help you.