How to implement clustering in Power BI using PyCaret

In one of the last articles We talked about how to create an anomaly detector in Power BI by integrating PyCaret into it, and help analysts and data analysts add machine learning to reports and dashboards without any extra work.
In this article, we will look at how to perform cluster analysis using PyCaret and Power BI. If you have not heard anything about PyCaret before, you can start getting acquainted with it here.
What we will discuss in today’s guide:
- What is clustering? Types of clustering.
- Learning without a teacher and implementing a clustering model in Power BI.
- Analysis of the results and visualization of information on the dashboard.
- How to deploy a clustering model on production in Power BI?
Before we begin …
If you’ve already used Python before, most likely you already have Anaconda on your computer. If not, you can download the Anaconda distribution with Python 3.7 or higher. from here.
Environment setup
Before you start using the PyCaret machine learning features in Power BI, you need to create a virtual environment and install it in it pycaret. To do this, we need to perform three steps:
Step 1 – Create a Virtual Environment
Open anaconda command prompt and enter the following:
conda create --name myenv python=3.7Step 2 – Install PyCaret
Run the following command at anaconda command prompt:
pip install pycaretInstallation may take 15-20 minutes. If you encounter any problems during the installation, you can familiarize yourself with their solution on our page on Github.
Step 3 – Indicate in Power BI where Python is installed
The virtual environment you create must be associated with Power BI. You can do this with Global settings in Power BI Desktop (File -> Options -> Global -> Python scripting). The Anaconda environment is put into the directory by default:
C:UsersusernameAppDataLocalContinuumanaconda3envsmyenv

What is clustering?
Clustering is a method of splitting data into groups according to similar characteristics. Such groups can be useful for studying data, identifying patterns, and analyzing subsets of data. Clustering data helps identify underlying data structures, which is useful in many industries. Here are some common uses for clustering in business:
- Marketing customer segmentation.
- Analysis of consumer behavior for promotions and discounts.
- Identification of geoclusters during an outbreak, such as, for example, COVID-19.
Clustering Types
Given the subjective nature of clustering tasks, there are various algorithms that are better suited for solving certain types of tasks. Each algorithm has its own characteristics and mathematical justification, which underlies the distribution of clusters.
In today’s tutorial, we are talking about cluster analysis in Power BI using a Python library called PyCaret and we will not go deep into mathematics.

Today we will use the k-means method – one of the simplest and most popular teaching methods without a teacher. You can find more information about the k-means method here.
Business context
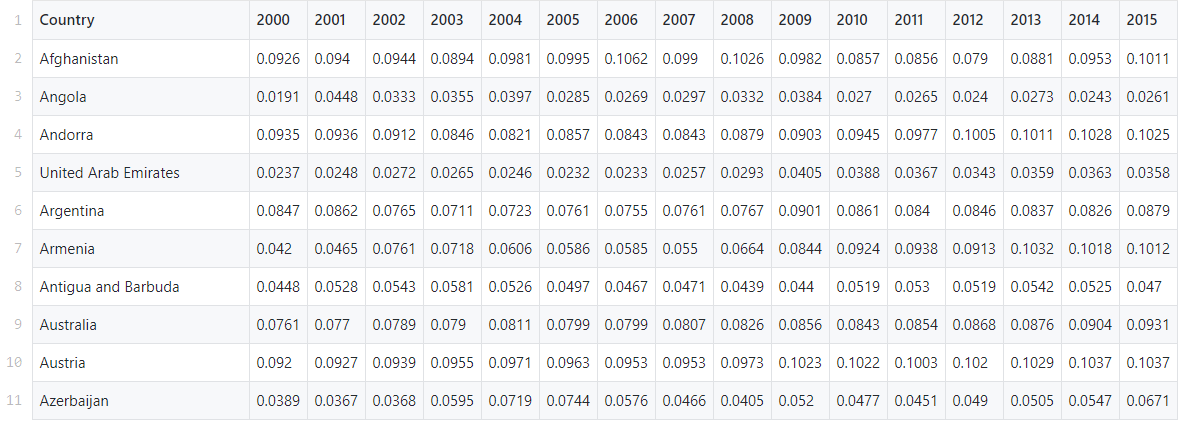
In this guide, we will use a pre-made dataset from the World Health Organization’s Global Health Expenditure database. It contains health expenditures as a percentage of national GDP for more than 200 countries from 2000 to 2017.
Our task is to find patterns and groups in this data using the k-means method.
Data can be found here.
So, let’s begin
Now that you have set up the Anaconda environment, installed PyCaret, you understand the basics of cluster analysis and the business context, it’s time to get down to business.
1. Data acquisition
The first step is to import the dataset into Power BI Desktop. You can download data using the web connector. (Power BI Desktop → Get Data → From Web)

Link to the csv file: https://github.com/pycaret/powerbi-clustering/blob/master/clustering.csv.
2. Model training
To learn the clustering model in Power BI, we need to execute a Python script in the Power Query Editor (Power Query Editor -> Transform -> Run python script) Use the following code as a script:
from pycaret.clustering import *
dataset = get_clusters(dataset, num_clusters=5, ignore_features=['Country'])
We ignored the column. “Country” dial using parameter ignore_features. There are many reasons why you might need to exclude certain columns in order to better train the machine learning model.
PyCaret allows you to hide unnecessary columns instead of deleting them, because you may need them in the future for further analysis. For example, now we did not want to use “Country” for training and passed this column to ignore_features.
There are 8 ready-to-use machine learning algorithms in PyCaret.
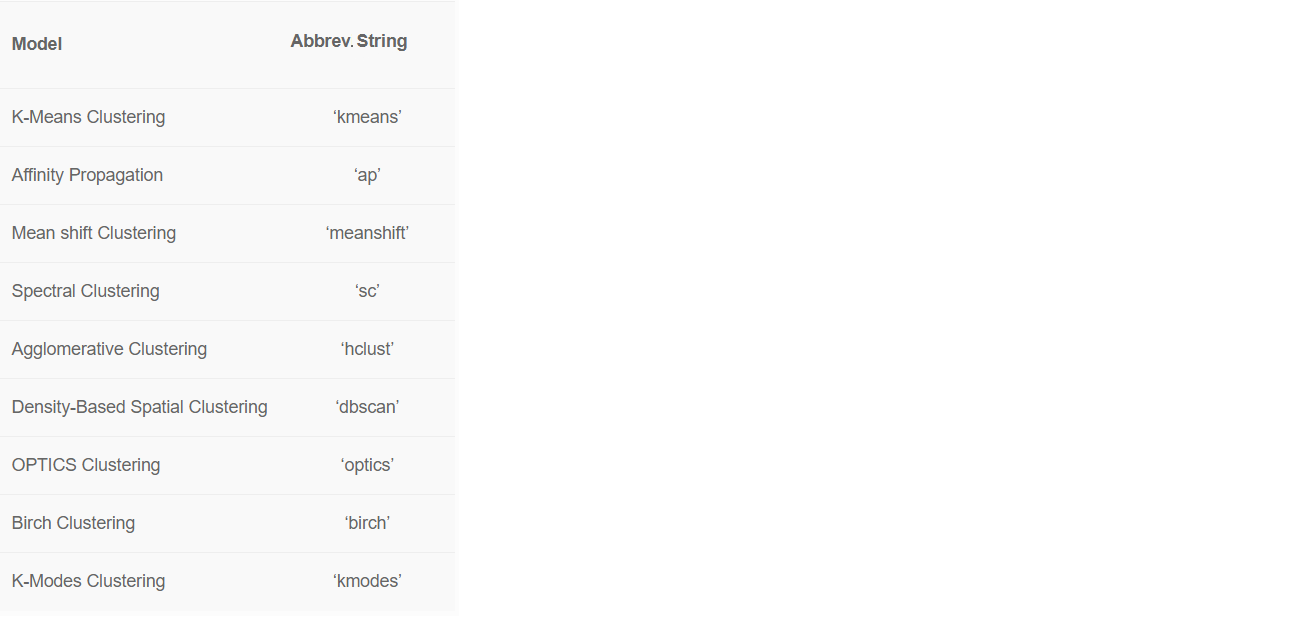
By default, PyCaret trains the k-means clustering model on four clusters. But the default values can be easily changed:
- To change the type of model, use the parameter model at
get_clusters(). - To change the number of clusters, use the option
num_clusters.
For example, this is how you can do k-means clustering into 6 clusters.
from pycaret.clustering import *
dataset = get_clusters(dataset, model='kmodes', num_clusters=6, ignore_features=['Country'])
Conclusion:
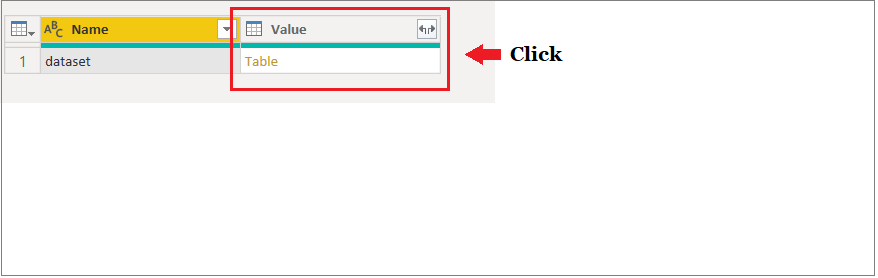

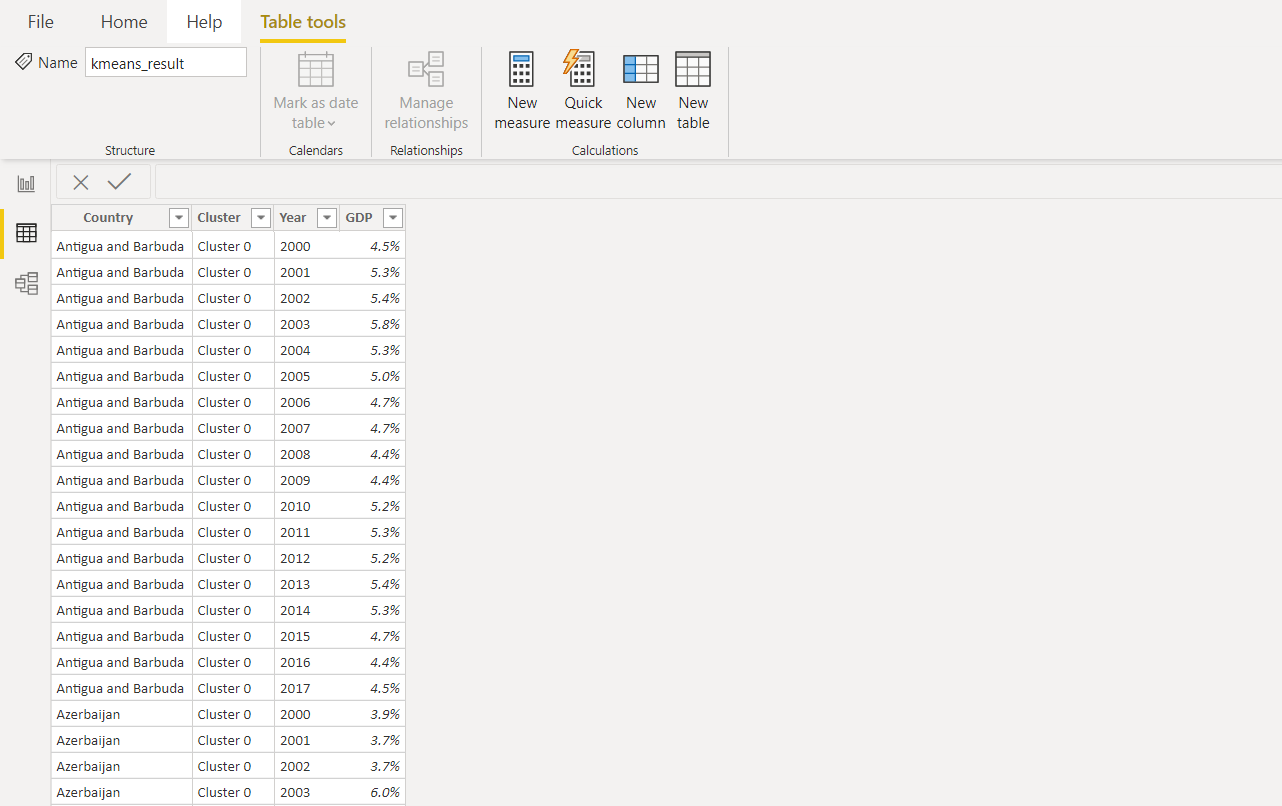
Another column with a cluster label is added to the original dataset. Then all the values in the column year used to normalize data and further visualize in Power BI.
This is how the end result will look in Power BI.
3. Dashboard
When you have acquired cluster labels in Power BI, you can visualize them in the dashboard in Power BI for analytics:
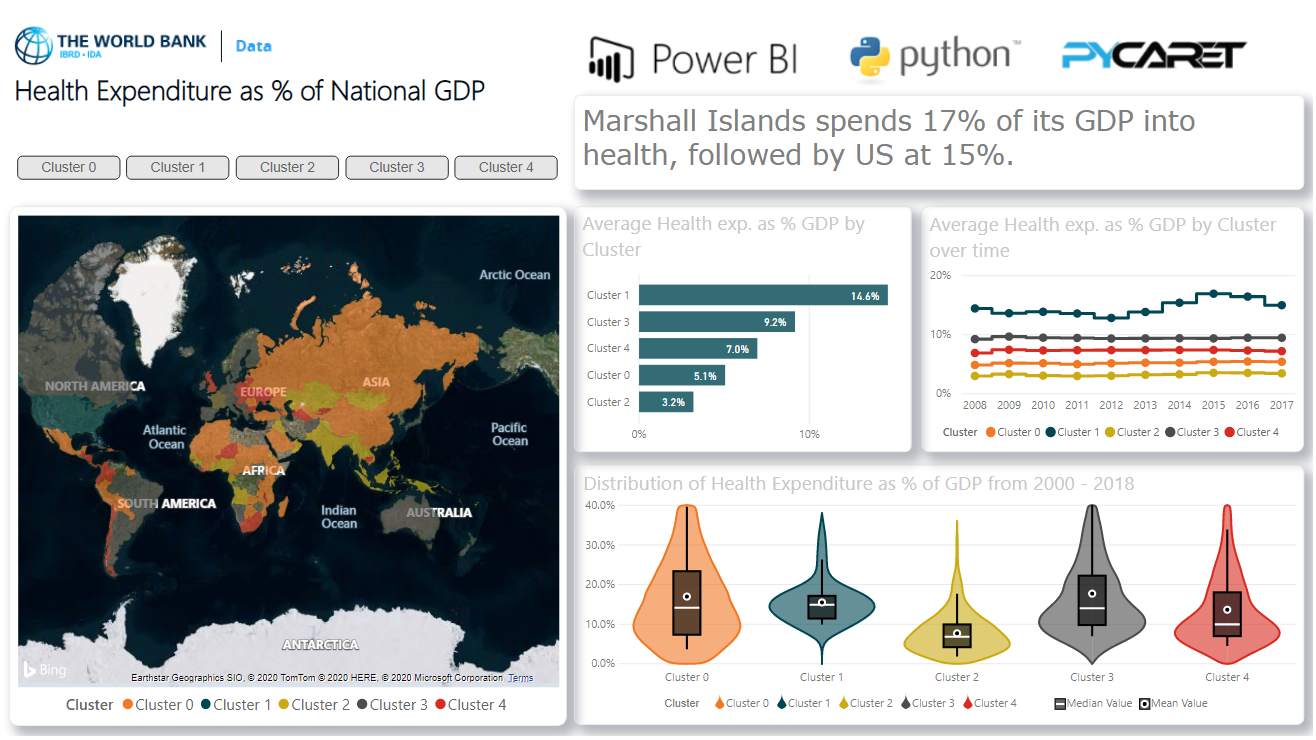
You can download the PBIX file and dataset from Github.
Clustering Implementation
Above, we demonstrated the simplest clustering implementation in Power BI. I note that this method trains the clustering model every time a dataset is updated in Power BI. This can be a problem for the following reasons:
- When the model is re-trained on the new data, the cluster labels can change (that is, if earlier some data points were assigned to the first cluster, then when re-trained, they can be assigned to the second cluster);
- You will not want to spend several hours each time re-training the model.
A more effective way to implement clustering in Power BI instead of re-learning over and over is to use a pre-trained model to create cluster labels.
Early Model Training
You can use any integrated development environment (IDE) or Notebook to train the model. In this example, we trained the clustering model in Visual Studio Code.
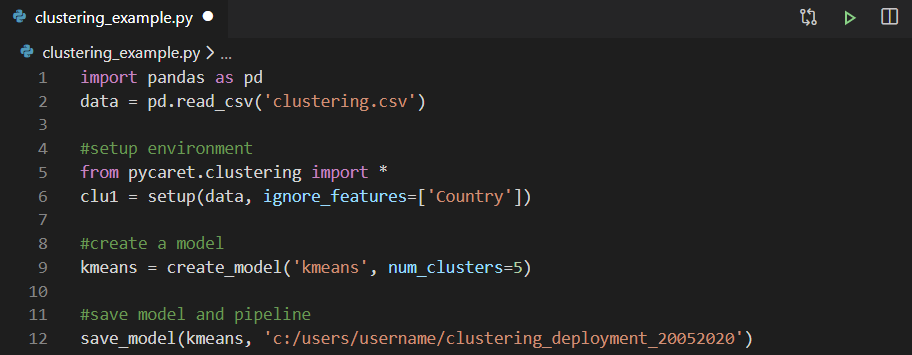
Then, the trained model is saved as a pickle file and imported into Power Query to generate cluster labels.

If you want to learn more about implementing cluster analysis in Jupyter notebook with PyCaret, watch this two-minute video.