How to connect to SAP Hana using Power BI
Hi all!
In this article, I will show you how to build a Power BI report on SAP Hana data. I did not find intelligible information on this subject on the Internet, so the idea came up to share information. It so happened that a new project came to our team – it was necessary to build analytics on SAP EWM data using Power BI as a visualization tool.
Once, while working as an SAP BW consultant back in 2019, I started using Power BI for my personal purposes as a hobby. It happened by accident. I wanted to analyze vacancies from a recruitment site, which I did. I have a separate post for this. Further more, as a result, a decent experience has accumulated. Thus, I became one of the developers on the above project😊.
What’s at the entrance? SAP EWM system (logistics, deliveries) and a bunch of graphs in Excel from the customer. Moreover, some charts should be updated at least once an hour – that is, almost in real time, fig. one.

What do you need? Classic :-). Extraction, transformation, data mart, BI reports. On reflection, we came to the conclusion that it is less problematic to use standard SAP BW extractors for extraction. To do this, I had to deploy the SAP BW module itself. This was done in the AWS cloud, fig. 2.

Connecting to SAP BW or Hana DB. Power BI can connect to SAP BW storefronts or directly to Hana DB. Working with SAP BW is known to be slower due to the additional virtual layer of BW objects (cube or BEx query). Therefore, it was decided to connect directly to Hana, and do the necessary transformations and connections on the virtual layer of Hana – Calculation View.
Import or Direct? We chose Direct, fig. 3. We had a requirement – some reports should be updated every hour. Import mode would require EWM -> BW -> Power BI download synchronization. With such a short interval, this is problematic. Plus, we are losing support for downloads in Power BI and related errors. Users could use the Power BI Pro license, which is half the price of the Premium version.

But the import mode has some limitations, the most significant is the limitation of the selected data array to a million rows. That is, if you display a table with more than 1 million rows, then this is a problem. Basically, dashboards use grouped data, hello SQL Group by 😊. So, limits of 1 million lines are reached in rare cases. Total: SAP EWM -> Instance BW(AWS Cloud) -> Power BI (Direct mode – connect to Hana)
Hana like Analytical source or Relation source? We chose the second. The Power BI manual says that the first mode is faster, but my personal testing showed that the second mode works the same way. I also wanted more flexibility and full use of the wonderful DAX language.
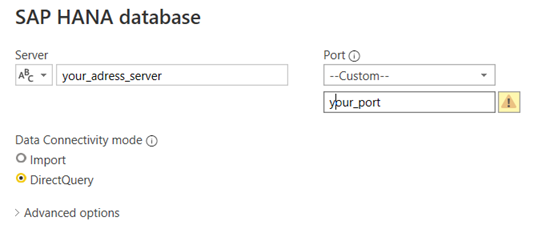
Connecting to SAP Hana. So, the extractor is done, the test data is loaded, the Calculation View is ready. Connecting! In Power BI, select the Hana data source, then you need to enter the server address and port, select the mode, fig. four.

At the second step, you need to enter the developer’s login/password. It is important that you can enter developer data, because after publishing the PBI file to the cloud, the connection uses the gateway (if configured). That is, the login / password is replaced by a technical user.
Gateway – special software that, after publishing the file, determines which server the file is connected to and automatically replaces the username and password of the user who published the report with a technical one. But for this you need to create and configure a gateway.
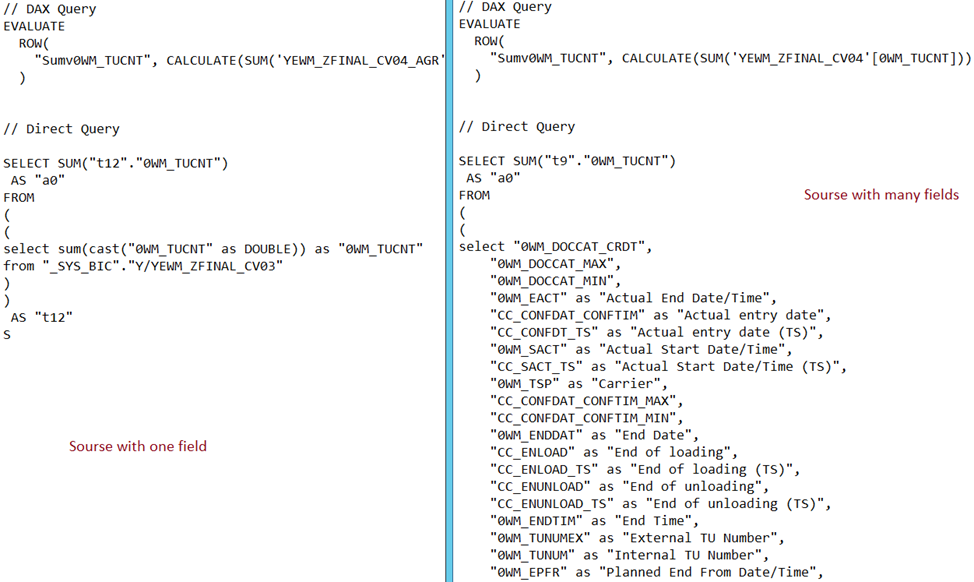
Choice of measures and dimensions. After connecting, go to the next screen. The screen below shows the Calculation view. You must select only those measures and dimensions that you need, fig. 5. The fact is that for each visualization in the report, its own SELECT to the database is formed, and nested. The nested SELECT just consists of the fields you selected at this step, fig. 6.
Figures 5, 6


input parameters. SAP Hana has a very useful feature as Input parameter. But its use in Power BI is limited. As you know, Power BI consists of two parts: loading and visualization. So, Input parameter can be used only at the first stage – loading. At the second stage, it can be changed using the Change Settings button, but it cannot be changed using visualizations such as Slice. And after the report is published in the cloud, it is impossible for an ordinary user to manage the Hana input parameters. We hope that the developers will soon provide such an opportunity.
Relationships between tables. In Direct qwery mode, you can build relationships between tables. There are no problems or restrictions with this. This is the difference between Analytical model vs Relation model.
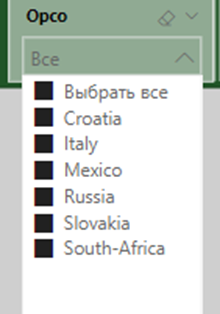
Directories (features), slices. In order for the slices (filters) to work out quickly, each slice was associated with a Feature View in Hana – we got a reference, Fig. 7. Next, we linked the references to the fact table. The result is a classic star scheme, fig. eight.
Figures 7, 8


That’s all! I hope this information on connecting Power BI to SAP Hana will help someone. I missed her a lot.


