How to calculate the discount for the first and last floor with almost no formulas in Excel
Continuing the stories about Big Data for mere mortals we suggest to try myself in solving the housing issue: how prices per square meter differ on different floors. The practical benefit of this note is to obtain, without much effort and without special skills, reliable knowledge about the expectations in the real estate market. The state hides the prices of real transactions, but it is possible to have an adequate idea of the mood of sellers without knowing an experienced realtor, the son of a mother’s friend.
The article is a step-by-step illustrated instruction for solving the problem of analyzing the number of storeys in urban development, incl. calculation of discounts for the first and last floors. Bryansk was adopted as a model city. The calculation file is attached and its sheets are numbered in the sequence of operations performed. The calculation template is easy to adapt to another city and type of property.
The stated approach is intended to argue the idea that Big Data is not the prerogative of satanist date, but to a certain extent accessible to non-specialists. The material may be of interest to everyone, except those who work with data professionally. The above techniques will be in demand in working with data for realtors and appraisers without programming skills. Technohardcore in this case is not about application insights frameworks type MapReduceand in the implementation of everything pipeline by means of a well-known office application.
The instruction consists of two parts. The first part outlines the procedure for preparation, initial familiarization with the data and clarification of the purpose of the study. In the second part, the calculation of the discount for the floor will be made.
The content of the material does not pretend to be academic. The main goal is to popularize working with data for those professions where it would be useful.
1. System requirements
For building big data infrastructure in this case, only Excel is required. Excel will collect data from bulletin boards, Excel will prepare it for use, Excel will visualize it and convert it into knowledge. Are you familiar with Excel? → if yes, then you are no longer office plankton, but experienced data engineer And data analyst!
Setting infrastructure for our case lies in configuration Excel with two add-ins. superstructure power query provides funds ETL. superstructure Robustik provides automation tools.
2.Dataset
original data set is the announcement data from one of the well-known bulletin boards. Dataset consists of 15 files in one folder, each of which contains ads collected during the calendar month (monthly market slice). Instructions for parsing real estate ads are set out in one of the previous publications.
3. Extract
We use Power Query to extract data from the dataset. The Power Query menu looks different in different versions of Excel. In versions 2010 and 2013, it must be installed additionally, and since 2016 it comes with Excel.
To merge data from 15 files and insert a new book into a sheet, you need to make a few clicks.
In the 2019 version, this menu is located here:

In the 2013 version, this menu is located here:

Then we combine and load:
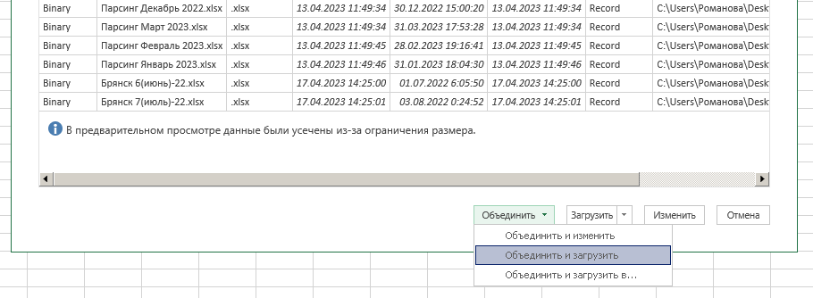
Then it remains to select a sheet with data:

Since the parser automatically generates the names of the sheets, the names of the sheets with data on apartments in Bryansk will be the same in all files. As a result, on one sheet No. 1, all available data from all files in the folder from sheets with the same name will be combined into one table.
In total, about 150 thousand records were extracted in this way. For scale enterprise it’s nothing. For a local SME, this is quite Big Data.
4. Transform
Removing extra columns
The initial data are located in 49 columns. Data from most columns will not be required. Delete extra columns of data.
In the 2019 version it looks like this:

In version 2013 it looks like this:

And then either remove the extra columns, or select those that need to be left.

In conclusion, we place the result on a new sheet No. 2:

Now let’s move on to working with strings.
Removing duplicates
Since the task does not assume a comparison of monthly slices, we do not need duplicates.
To remove duplicates, make active sheet number 2 → from the table → select the itemID column →

delete lines -> remove duplicates:
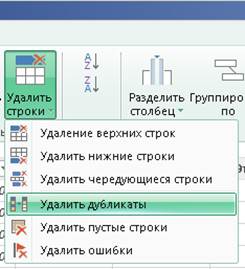
itemID are the ad numbers. Deleting rows with duplicate ad numbers means that entries of the same ad published during different months will be deleted.
In conclusion, we place the result on a new sheet No. 3 → close and download.
Removing extra categories
The source data includes sales, purchases, and leases. We restrict ourselves to sales data.
Also, we will not consider the specifics of new buildings, leaving only the secondary market.
For this operation, make sheet No. 3 active → from the table → open the column filter Offer → leave checkbox Sell:

Similarly, in the Market column, clear the checkbox New building:

In conclusion, we place the result on a new sheet No. 4: close and download.
At this point, we consider the data prepared for analysis.
Note that it only took a little mouse click to prepare the data. Formulas were not used at all.
5. Analysis
Clusters of floors
For a general understanding of the city in terms of number of storeys, let us consider the distribution of buildings by number of storeys and the location of the number of storeys on the territory.
Make active sheet number 4 → from the table → select the column number of storeys → group:

→ In the table, after grouping, select the Floors column → sort:

In conclusion, we place the result on a new sheet No. 5: close and download.
There is now a table on sheet #5:

For a visual representation, we will build a graph on these data:

As you can see from the graph, the city is predominantly five-story. Keeping in mind that the data was parsed on demand for the Bryansk region, it can be assumed that low-rise buildings are largely spread over the territory of the entire region.
The next largest group consists of 9-10-storey buildings. The last group in terms of number consists of 14 – 17 floors.
From a visual assessment, it can be noted that each group of floors corresponds to its own historical period. Each period is characterized not only by the prevailing norms and construction technology, but also by the relationship between the authorities and society (as far as it is possible to compact citizens per square meter of development), and the predominant contingent (pensioners, descendants of industrial workers, minions of the “before” period, the ghetto of the “after” period). , etc.).
Based on the initial assessment of the number of storeys, we will form territorial clusters within them. Thanks to this, homogeneous groups of objects with a minimum spread of characteristics will be obtained. This will better highlight the influence of the first/last floor factor due to the low level of noise from location and number of storey factors.
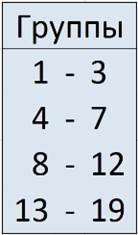
We divide the data into groups of floors:
On the chart:

Clusters by territory
Let’s prepare the data for plotting the cluster for the group of storeys 1 – 3.
We make sheet No. 4 active → from the table → select columns → (holding Ctrl) latitude, longitude, number of floors.
In conclusion, we place the result on a new sheet No. 6: close and download.
We make sheet No. 6 active → from the table → open the column filter Floors → leave checkboxes 1,2 and 3 → close and load into sheet 7.1-3:

Similarly, we load data for group 4 – 7 on sheet 7.4-7, groups 8 – 12 on sheet 7.8-12 and groups 13 – 19 on sheet 7.13-19.
Next, we create sheet No. 8.1-3 and add a map template to it. Working with the map is discussed in detail in the previous article.
We insert a link to columns A:B in sheet No. 7.1-3 into the map template, the RGB blue color has a code of 0,0,255.

As a result, we get an empty map somewhere in Belarus:

This happened because they did not clean the data in the columns Latitude And Longitude. An empty map is not a problem → you need to zoom in on the map with the mouse wheel until the marks appear on it:

Then drag Bryansk to the center of the map with the mouse and zoom back:
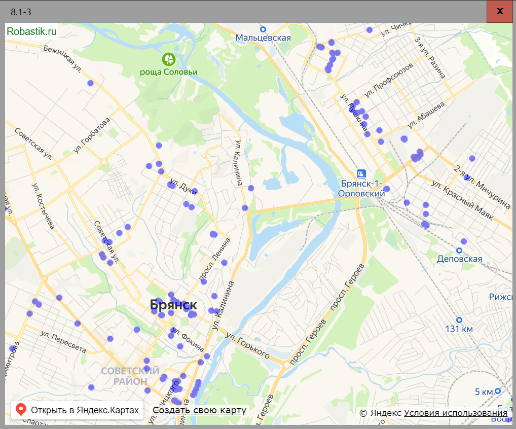
As expected, low-rise buildings do not form blocks of continuous development.
Similarly, we will build a graph on the map for the remaining groups of floors.
Floors 4 – 7 outside the city are concentrated in regional centers:

In the city, the number of storeys 4 – 7 is located in blocks of continuous buildings:

Let’s define a territorial cluster at the intersection of Liteinaya and Novo-Sovietskaya streets:

Let’s open this place on the site 2gis.ru and determine the coordinates of the cluster center:

Here we use the tool Ruler and measure the size of the cluster (the radius of the circle containing residential buildings):
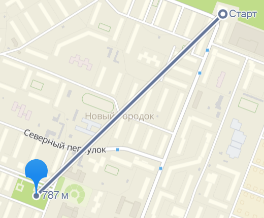
With the help of these data, it is possible to determine the circle, which includes the objects of the territorial cluster. The circle is used to select the data included in the cluster.
Similarly, we repeat with the territorial cluster between Kostycheva and Krasnoarmeyskaya – Aviation streets:

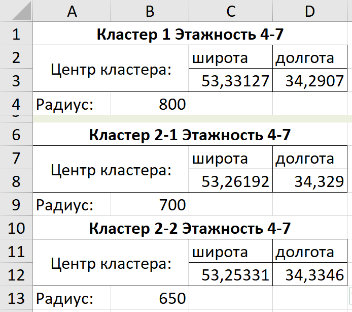
Since the cluster is very elongated, we use two circles to define it: 1) with a center of 53.261924° 34.32897° and a radius of 700 meters, 2) with a center of 53.253313° 34.334564° and a radius of 650 meters.
Let’s build the selected territorial clusters on the map.
Let’s use the function Distance:

The cluster will include those points, the distance from which to the center of the cluster is less than the radius of the circle.
On sheet No. 9.4-7, we write a summary of the circles defining the clusters:
According to these data, we will add new columns with a formula for calculation on sheet No. 7.4-7. If the distance from the point to the center of the circle is less than the radius, then the point is included in the cluster:

To form a selection of points that are included and not included in territorial clusters, make sheet No. 7.4-7 active → from the table → in the filter of the Cluster 1 column, uncheck FALSE → delete all columns except latitude and longitude → close and load → name the new sheet 10.4- 7.1.
Similarly, from cluster 2-1 we load into sheet No. 10.4-7.21 and from cluster 2-2 we load into sheet No. 10.4-7.22. Then we combine them into sheet No. 10.4-7.2.
To obtain a sample of data not included in the territorial clusters, subtract tables 10.4-7.1, 10.4-7.21 and 10.4-7.22 from the table on sheet 7.4-7 and load them into sheet 10.4-7.0.
Fill out the card template:

Displaying the result:

Similarly for floors 8 – 12:

And for 13 – 19:

In conclusion – all clusters together:

All data used:

It is worth paying attention to the fact that only one formula was required to prepare the data.
The prepared data will then be used to calculate the floor discount in the second part of the instruction.
The file with data and calculations (in the next part also discounts for the first and last floor) can be downloaded Here.