How does tracing requests with open-source Glowroot help the Atlassian engineer?
In this article, I will tell a story about how you can face a rather simple problem on large installations of Atlassian products, in particular on Jira.
Methods for analyzing and finding bottlenecks:
-
statistics
-
sampling
-
profiling and tracing
In this article, we will analyze the request trace, which shows almost the entire segment of the request, namely from the beginning of the request from the client’s browser to the transition to the reverse proxy, if it exists, to the application server and from it to caches, Lucene search indexes, DBMS.
An important point is that it is difficult to analyze the system on the part of the customer, since they had strict requirements for the use of the tools that are listed in the requirements.
Requirements
The cost of APM tools (performance monitoring tools) was not initially included in the project budget, so one of the main selection criteria was the free solution. Another important point – it was necessary to pre-check the tool for vulnerabilities and malicious code. It became obvious that in order to satisfy the first two search criteria, you need to look for open source solutions. Another requirement is that the data does not go beyond the limited contour, and there was an additional possibility of integration with the existing infrastructure.
Therefore, the criteria for choosing a tool were as follows:
-
free;
-
installation on our own infrastructure (On-Premise);
-
open source;
-
the ability to integrate with Elasticsearch (Opendistro);
-
JVM compatibility (since Atlassian is written mostly in Java), or as javaagent;
-
the ability to bind an HTTP request with SQL requests;
-
availability of graphs in percentiles;
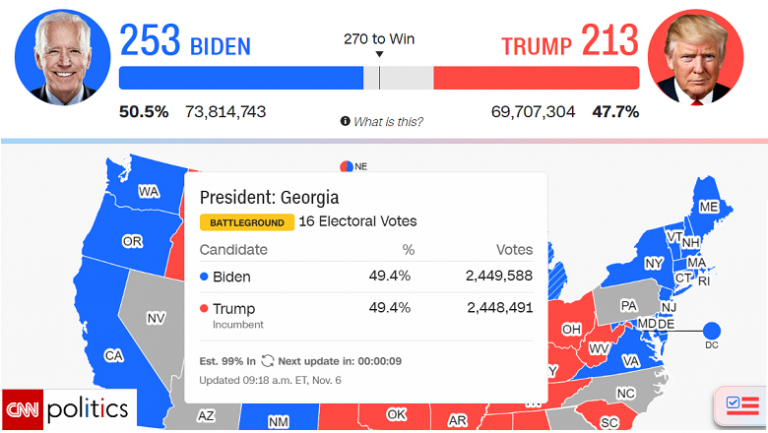
For me, the last point is important because it helps to identify the starting point so as not to deal with the consequences. In the figure below, you can see that the problem actually started at 12 o’clock in the morning, and not after 1 hour. In the absence of division by percentiles, you can easily spend a lot of time eliminating symptoms and only then sort out the cause. Of course, there are different cases.

The site was used as a starting point. https://openapm.io/landscape, which has collected almost all current APM tools. After conducting a comparative analysis, we opted for the instrument Glowrootthat met all the criteria.
Installation
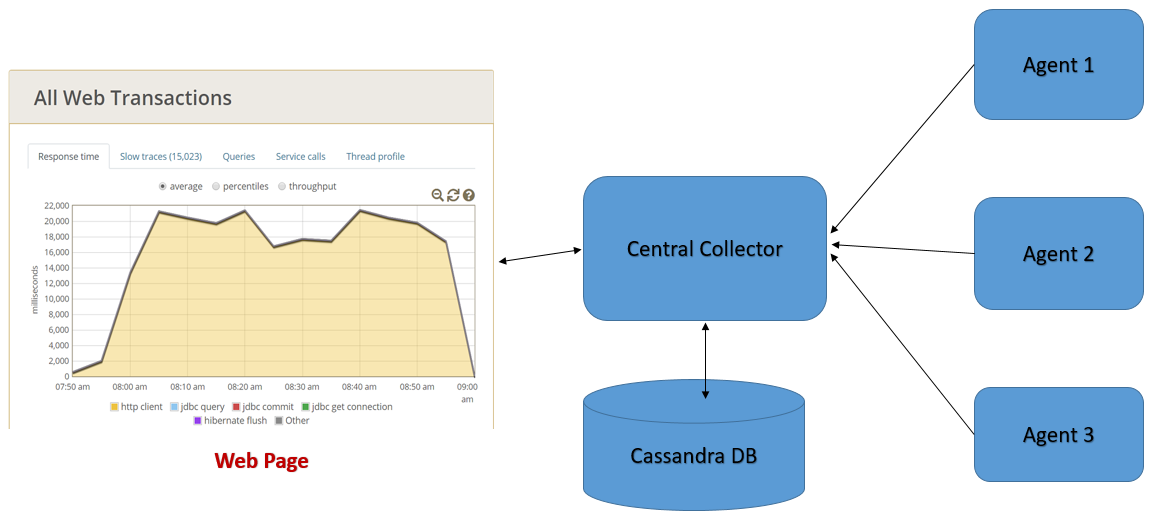
Installation of the application is quite simple on agents, and this article shows a scheme for working with a built-in collector, but for industrial installations, Cassandra is used (as shown in the diagram) with a bundle with Elasticsearch.
-
Downloading the installer
wget -c https://github.com/glowroot/glowroot/releases/download/v0.13.6/glowroot-0.13.6-dist.zip2. To check, create a directory mkdir -p / jira / glowroot / tmp, so that the owner of the Jira application process can write to the same directory, and set the ownership for simplicity, but it is recommended to just give the write ability to the owner of the Jira process
chown -R jira: /jira/home/glowroot3. Install an additional argument in setenv.sh in the jira installation directory, in our case it is / jira / current / bin. By default, Atlassian uses the / opt / atlassian / jira / bin directory in the file, add the following line:
JVM_SUPPORT_RECOMMENDED_ARGS="-javaagent:/jira/glowroot/glowroot.jar ${JVM_SUPPORT_RECOMMENDED_ARGS}"4.After restarting the application:
systemctl restart jiraAnd we monitor for errors using the command:
tail -f {jira_installation_directory}/logs/catalina.out Since the default address is 127.0.0.1, go to the directory in glowroot and see that files such as admin.json have appeared. In it, you can change bindAddress to 0.0.0.0 or to whatever you need. In my case, I will add contextPath – / glowroot…
And then on the reverse proxy (in this case, nginx), set:
location /glowroot {
		proxy_pass http://127.0.0.1:4000;
}
Additionally, you can look at the attached documentation Agent-Installation- (with-Embedded-Collector)
As a result, at our address jira.example.com/ glowroot sees transactions.

Primary analyzes
After some time, the graphs and samples are replenished, as a result, the bottleneck engineer begins to create many problems.
For example, that the integrations are slow, and some of the requests are synchronous or the requests are duplicated.

The larger the system, the more unexpected surprises
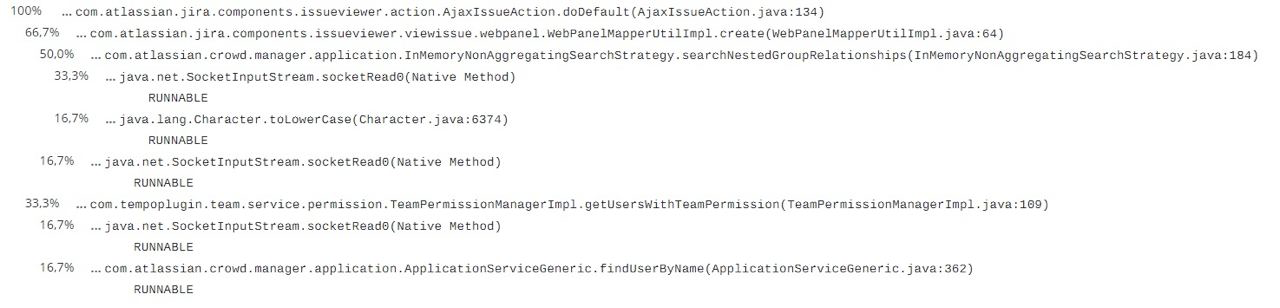
Using glowroot, it was found that every time a task was changed in a project with more than 30,000 users, temporary tables were created on the side of the DBMS when checking the rights. Below is a trace that demonstrates this.
As a result, temporary tables are created on the PostgreSQL side, and on a PostgreSQL cluster, this activity greatly affects performance due to the high IOPS.

The question arose – why caching on the side of the Jira application did not work, because according to the thread dump of the information it shows that there is object caching.
According to the stacktrace, it was clear from the traced request that the caching implementation was done absolutely conveniently.

When examining the stacktrace, it was found that the method createTemporaryTablesIfNeeded influenced this performance degradation.
And the pull request below changed the behavior of the application, https://bitbucket.org/atlassian/entity-engine/pull-requests/32/stable-issue-stable-issue-raid-438-in/diffas a result, we faced this problem on a large installation.

The reason for the change was to limit misconfigured projects and limit really large projects. So this solution is a pretty pragmatic solution in software engineering.
As a conclusion
As we can see from the example of a change in the entity engine, the vendor is also worried about the product and gladly accepts requests for enhancements if it concerns their component.
And we solved our problems by reassembling the components for our realities, without waiting for the correct and official fix.
In fact, we had the following options for eliminating application behavior for a large number of users:
-
Change constant and rebuild component
-
Change the security rights schema at the application level and do a cleanup and full review
-
Convert to unlogged table cwd_users in PostgreSQL
Tell me, have you encountered a similar situation and how did you solve it? Especially, are you interested in situations related to finding bottlenecks in the system using performance analysis tools? How much time did you spend installing, configuring tools, and troubleshooting problems?
I will be glad to your questions, and you can also ask Atlassian community on Telegram…
Have a nice day, Gonchik.