Hello Emote! Examining the RAM dump infected by Emotet
Hello everyone, as I promised in the first part of the article “Hi Emotet!”in the next article we will start investigating the incident in the RAM dump and at the same time go through exercise from cyberdefenders.org by answering 10 simple questions, and also find out how the malware hides its activity in hidden processes and how he manages to bypass the means of information protection. Let’s analyze a common Direct Kernel Object Manipulation (DKOM) attack, which is often used by Rootkits.
In the article I will try to explain how some structures are arranged in memory, including: the structure of the kernel and executable processes. But not a single article is enough for a detailed explanation, so if you have a desire to find out more detailed information about the structures: kernel, processes and investigation of incidents in RAM dumps, I recommend getting the book “The Art of Memory Forensics” by Michael Hale Ligh, Andrew Case, Jamie Levy, AAron Walters. The book contains all the necessary basic information about the structure of the OS, kernel, processes, etc., not only Windows, but also Linux, as well as Mac. Due to changes in OS versions, the information is somewhat outdated, the basic material in the book is definitely a must-have for studying.
A properly selected set of utilities and a well-prepared stand are the key to success in investigating incidents, so let’s start with that. I will use SIFT (by SANS), because it already contains a set of necessary utilities and plug-ins.
The main utility that we will use today is, of course, familiar to many, volatility in python2.
Part 2 of the Hello Emotet series!
First of all, download the RAM dump with the Trojan inside and unzip it to SIFT (Figure 1)

In order not to access it constantly with “-f dump.vmem”, add the location of the RAM dump file to the environment variable:
export VOLATILITY_LOCATION=file:///home/sansforensics/Desktop/Emotet_dump/banking-malware.vmem (picture 2)
Now we need to know the name of the OS profile in order to work correctly with the content (processes, files, etc.) and at the same time answer the first question What profile should you use for this memory sample?
To do this, we will use the kdbgscan plugin, which is found by the Kernel Debugger Data Block (KDBG), the result is in Figure 3.
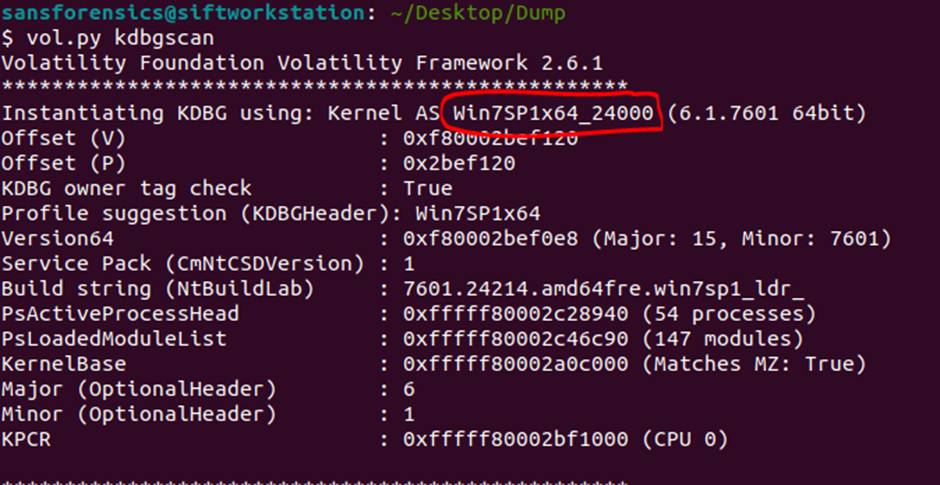
We will receive comprehensive information about the structure of the OS, including the indication of the profile and the proposed profiles (there are 8 of them). You can determine that the profile is selected correctly using the following plugins:
pslist;
psscan;
filescan;
hivelist.
If the profile is not correct, you will get unreadable or garbled results after running these plugins.
Here we will find the virtual and physical addresses and immediately answer the second question (Figure 4):
What is the KDBG virtual address of the memory sample?
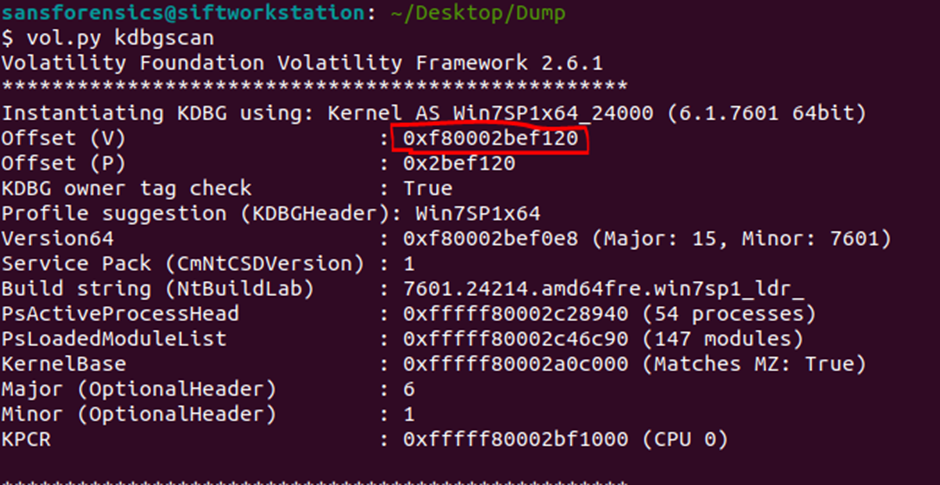
Also, you can use the imageinfo plugin, but with it you will get a little less information.
For convenience, in order not to pass a profile indication in each volatility call (–profile=’win7sp1x64_2400′), we export the profile name to an environment variable:
export VOLATILITY_PROFILE=’Win7SP1x64_24000′
Done, now, by running vol.py, we can immediately use the plugins, without specifying the location and profile, for example, get a list of active processes: vol.py pslist
In the next question There is a malicious process running, but it’s hidden. What’s its name? we are asked to find the name of a hidden process. What is this process, why and from whom is it hidden?
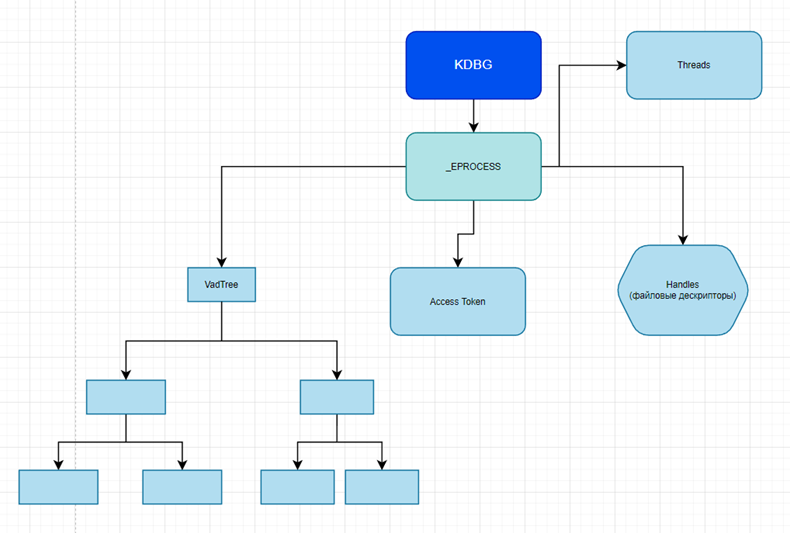
Kernel Debugger Data Block (KDBG) has a pointer to the _EPROCESS block list structure, where each block points to objects: handles, VAD Tree, Access Tokens, Threads, Process Environment Block (PEB for understanding, this includes executable files, dlls, etc. e). Also, this structure contains all the other information about the process, the directory from which the executable file was launched, the user who launched it, the time, and much more. In fact, most Volatility plugins work with this structure.
And we will work with these objects. Visually, the scheme described above looks like this:
Also in the _EPROCESS structure there is a chain of processes and links ActiveProcessLinks (pointed to by PsActiveProcessHead from KDBG), this chain is called doublelinked and looks like in Figure 5:
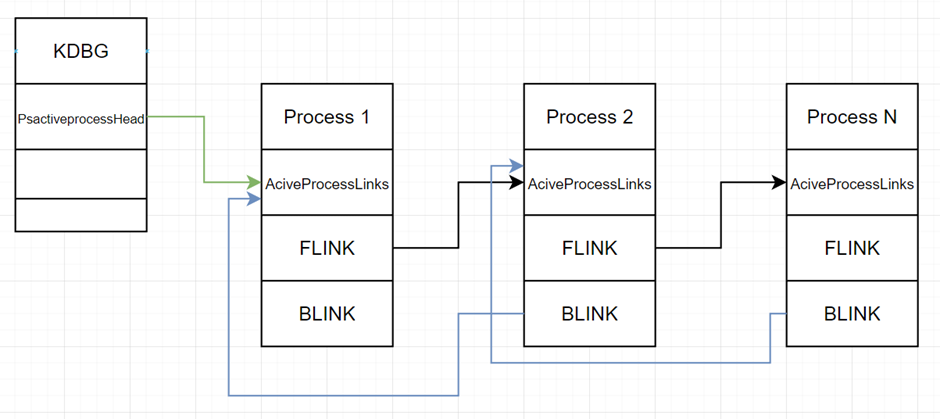
Forward Link (Flink) or forward link, points to the address of an ActiveProcessLink structure next process, and Backward Link (Blink) points to the address of the ActiveProcessLink structure previous process.
In the case of hidden
process, Forward Link literally jumps
through the process in front and points to the address of the ActiveProcessLink structure of the next process, the same
the most is produced in relation to the Backward Link, thus the process
becomes hidden. This means that when viewing running
processes in the task manager and through the tasklist console, as well as process explorer, we will not see it.
This principle underlies the DKOM attack, during which malware changes objects
kernel directly in memory. Such changes do not leave traces on the disk and
allow you to bypass the means of protection: AVZ and others.
What does a hidden process chain look like? Process 2 displayed in Figure 6.
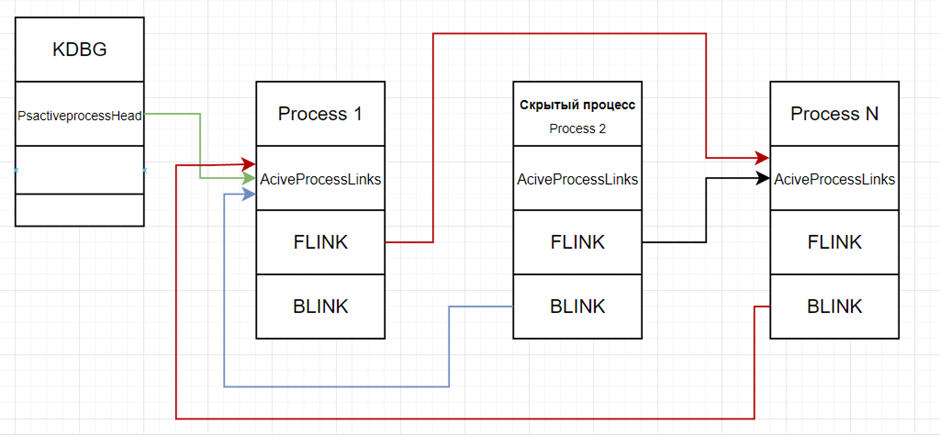
As we can see, no process points to its ActiveProcessLinks structure. Process 1’s Flink points to Process N’s ActiveProcessLinks, while Process N’s Blink points to Process 1’s ActiveProcessLinks structure, instead of Process 2’s structure. I marked the changed pointers in red in comparison to the diagram in Figure 5.
We have finished with a brief theory, now we will continue our practice. And to answer the question, let me remind you: There is a malicious process running, but it’s hidden. What’s its name? we will use the psxview plugin, which will show us that one of the processes has been hidden (Figure 7), in which case the pslist and psscan plugins will not display it, because they go through the chain of those same Flink & Blink links, they work similarly: Task Manager, Process Explorer, tasklist.
The psxview plugin allows you to find hidden processes and displays the name, PID, physical address and other information about the processes. This is achieved due to the fact that, unlike the pslist plugin, which reads _EPROCESS double linked list, this plugin does not scan only the chain of links that is tied to ActiveProcessLinks addresses, but combines several plugins at once:
pslist – reads _EPROCESS double linked list;
psscan – reads _EPROCESS structures, displays completed processes, sometimes helps to find rootkits;
thrdproc – processes and threads;
pspeid – PspCid table keeps track of processes and threads;
csrss – stores the handle of the process that started after (True) or before (False);
session – a list of processes belonging to each login session;
deskthrd – define processes by threads that are attached to each desktop.
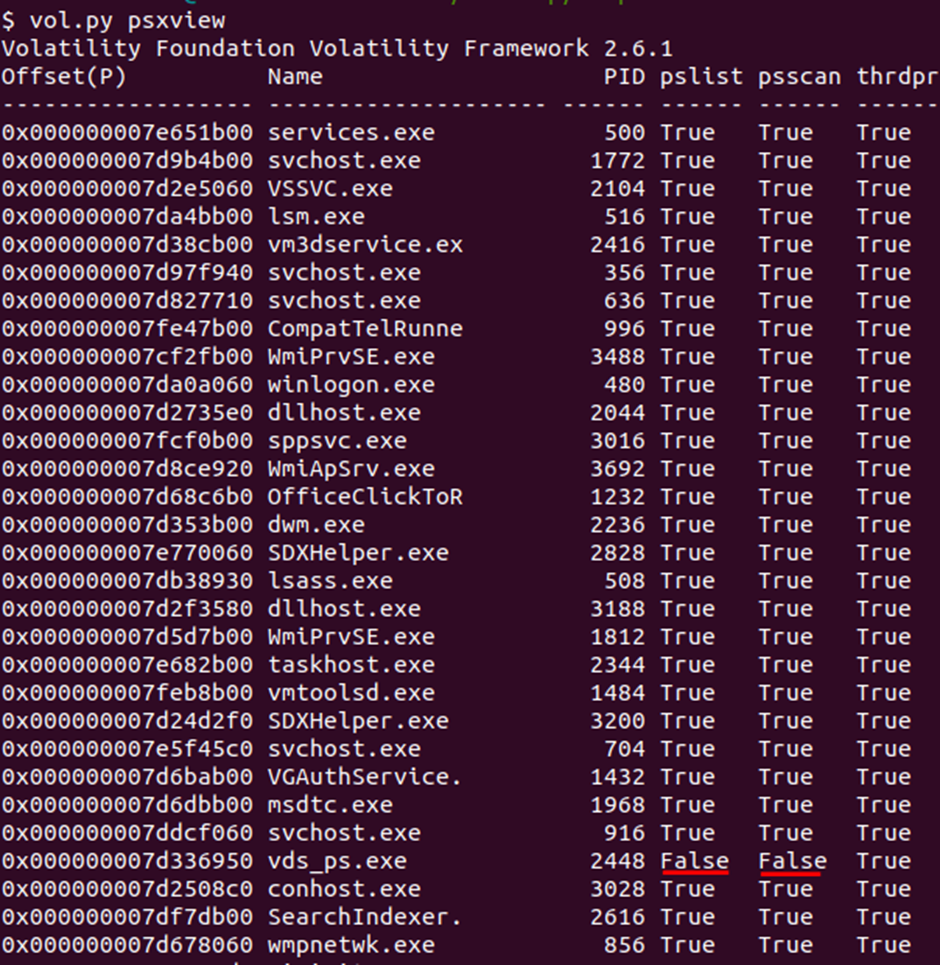
Thus, we have determined that the process named vds_ps.exe, PID:2448 and physical address 0x000000007d336950 hidden because is False for pslist & psscan. Which allows us to answer the following question about the process address: What is the physical offset of the malicious process? (found earlier).
To answer the question about the process path: What is the full path (including executable name) of the hidden executable? we can go several ways at once. Now I will show a simple way to find a path and later in the article I will tell a more complex way. So, after we have determined the address of the process, let’s see its path, as well as all the dlls that it uses (Figure 8), of course, information about the location of the running executable file can also be found in Prefetch and ShimCahe, but I will go through dlllist:
vol.py –offset=0x000000007d336950 dlllist

Let’s immediately dump the process into the current directory and see what information is available on known signatures on virustotal (Figures 9 and 10):
vol.py procdump –offset=0x000000007d336950 -D .

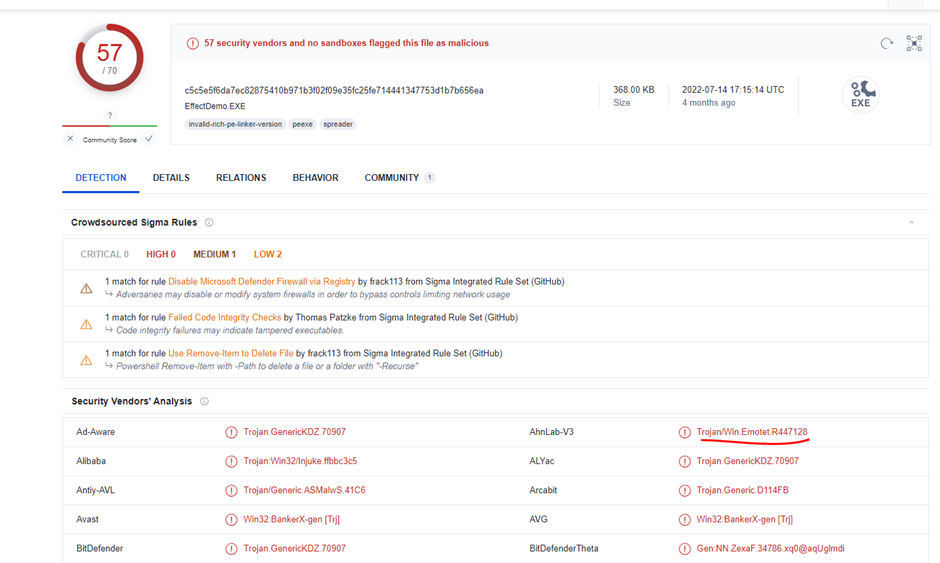
Before us is Emotet, unexpectedly, of course, given that the task calls Emotet. Let’s answer the next question Which malware is this?
To answer a question The malicious process had two PEs injected into its memory. What’s the size in bytes of the Vad that contains the largest injected PE? Answer in hex, like: 0xABC we will use the malfind plugin, which allows you to find traces for most process injection techniques (Figure 11) here we immediately dump the injected code found by the plugin into the current directory:
vol.py malfind –offset=0x000000007d336950 -D .
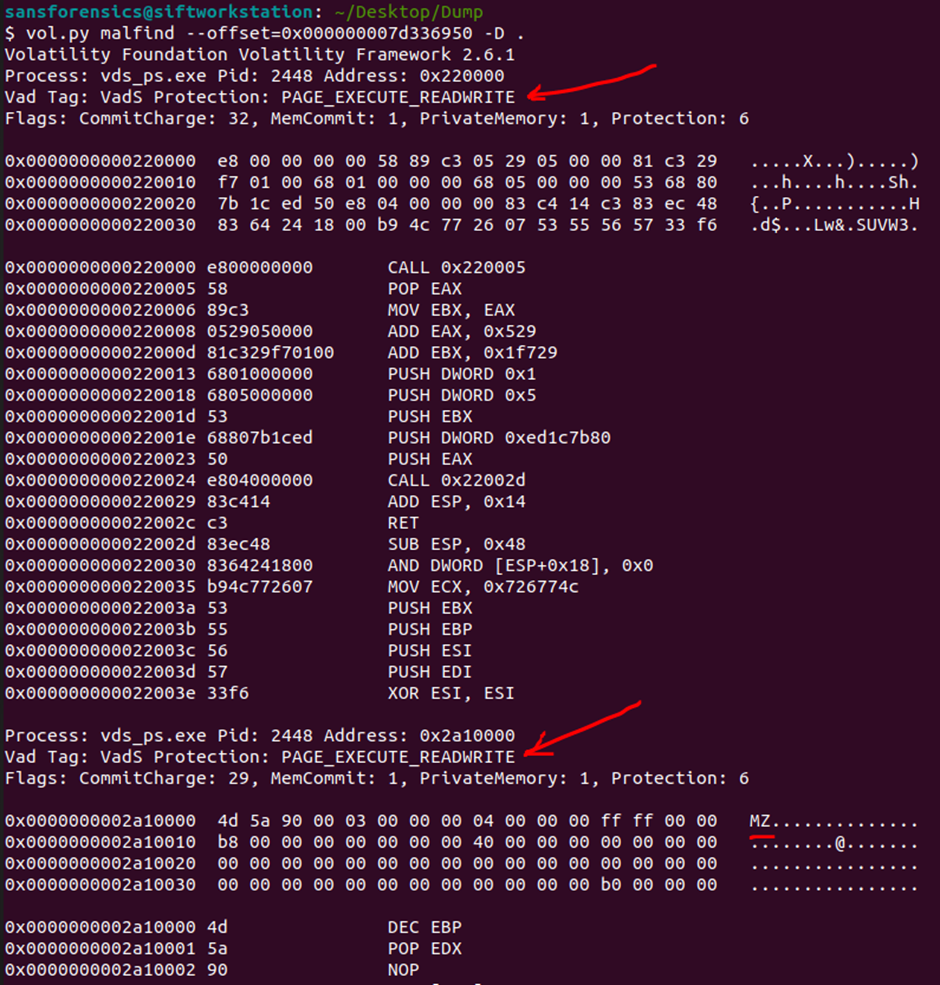
Note that the PAGE_EXECUTE_READWRITE memory protection type for naturally loaded executables is not normal (red arrows). The normal memory protection state for legitimately loaded executables is PAGE_EXECUTE_WRITECOPY. This tells us that the process has been injected, because this changes the type of memory, we will find the Windows API function responsible for this below.
Let’s look at the functions used by the malicious process using the strings utility (Figure 12):
strings process.0xfffffa8004536950.0x220000.dmp
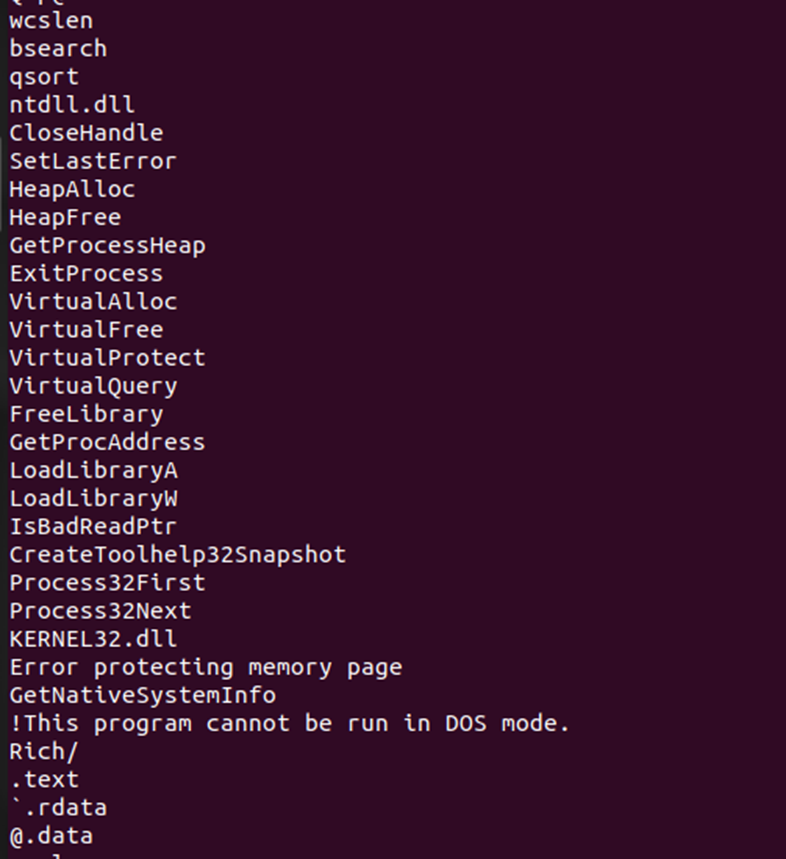
Here we see the “full set”:
Process32First/Next and CreateToolhelp32Snapshot allow you to find the desired process (often functions are used to DLL injections).
VirtualProtect allows you to change the type of protection for individual sections of memory.
GetProcAddress and other functions from the kernel32.dll library.
To answer the question, we only need to take last used address in memory for the largest dump: process.0xfffffa8004536950.0x2a80000.dmp.
For this I will use ndisasm in REMnux (in SIFT) the utility is missing and I will output the last few disassembled lines (Fig. 13):

In order not to overload with information, the 3rd final part of the series of articles will be released immediately after “Hello Emotet!”.
Part 3 of the Hello Emotet! the fun beginswe put aside the plugins that automate our work and go for a walk along the narrow corridors of memory, in search of artifacts…
