GIS on machine learning: stores in the best locations and the development of the “last mile”

Author: Artyom Gudov, Head of Investment Department, M.Video-Eldorado Group
M.Video-Eldorado Group operates as an online business, the ONE RETAIL model allows us to combine stores with our online platform, transfer all processes, the entire customer experience to any point of contact (at home, at work, in the store) on the Internet , on the way). An integral part of the transition to online is the automation of not only front-processes directly related to the client, but also back-systems that support infrastructure and decision-making efficiency. Thus, GIS is one of the elements of business digitalization.
In addition, GIS helps automate decision making based on data analytics and manage existing stores. So, after the introduction of quarantine measures that limited the work of non-food retail, GIS helped us determine which stores are best suited for distribution points and which partner PVZ (we work with Pyaterochka and Russian Post) will be most convenient for our customers.
How to implement GIS
Before the introduction of GIS, decisions about expansion, that is, the opening of new stores, were made on the basis of expert evaluations of business units. Then we introduced the analysis of similar stores and began to compare stores in comparable locations and look at this experience, what new points can give.
The implementation of the automated system began with three modules, which now form the foundation of the platform.
Module 1 – Heatmaps
A heat map is a city map divided into 600 × 600 m squares. The color of the square shows the location’s potential in terms of opening a new store. Green squares are the most attractive.

Heatmap with shopping centers
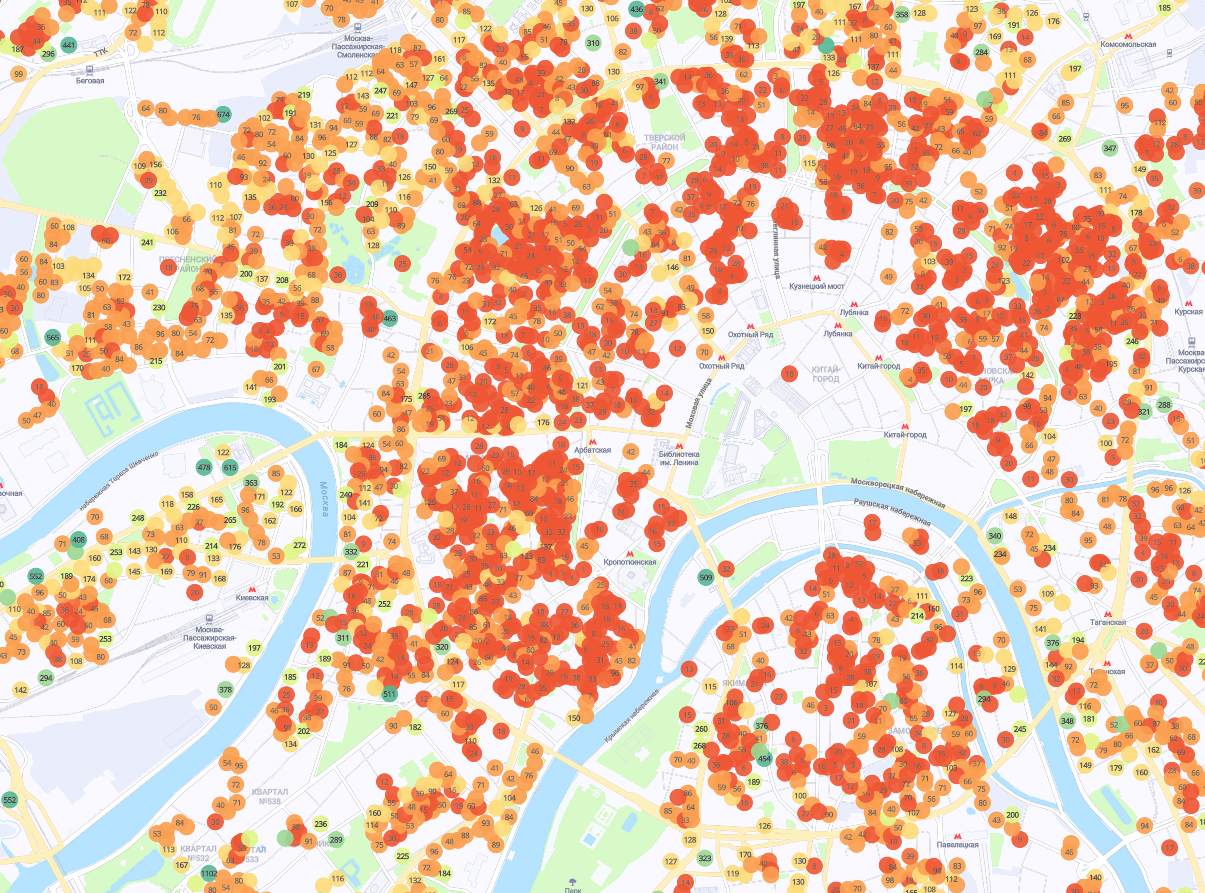
The module contains maps of more than 300 cities of the Russian Federation. For the calculation we use many parameters with a deep degree of detail. For example: pedestrian, automobile and transit traffic, data on the estimated income of residents of each house, market size, potential turnover of stores in cities, evaluation of cannibalization of sales, and others.

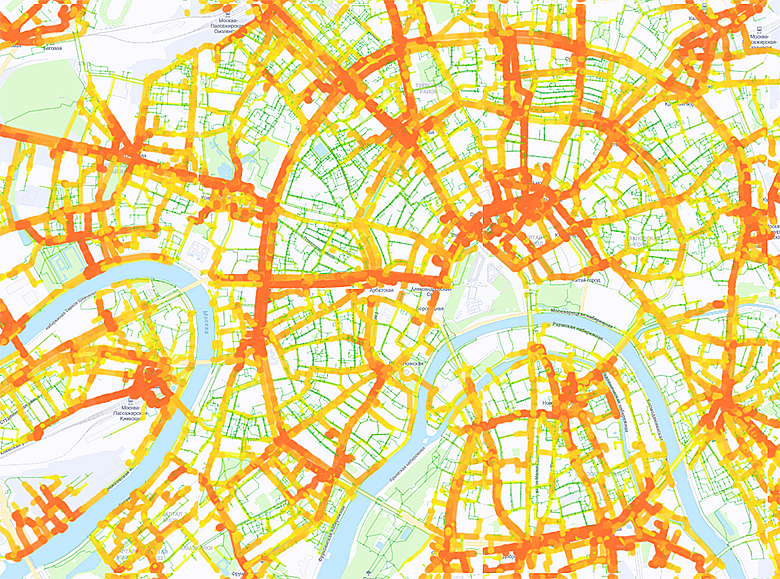
Map with car traffic
Map with the number of public transport routes
Heat maps have about ten layers. They show our stores (M.Video and Eldorado), competitors’ stores, target locations, elements of transport infrastructure, shopping centers and business centers, such as points of attraction, mobile phone stores, new buildings, etc.
Separate layer – estimated turnovers for stores of key competitors (we use open estimates from several suppliers). These are not only large retail chains, but also telecom operators, Internet retailers, and regional competitors.

Map with sales points of competitors and communication stores
Another important layer is the analysis of market rental rates. It shows the available space and rental rates for commercial real estate. Basically, these are medium, small shopping centers and street retail points.
Recently, we added anonymized shopping information to our heat cards with our loyalty cards and customer deliveries. That is, we can see where people live who buy goods in a particular store. This is necessary to evaluate cannibalization: will a new store not “eat away” sales from already opened ones.
Cannibalization is a difficult indicator to analyze. Usually it applies to several existing stores at once, especially when a new one is large. For example, if a store’s sales decreased compared to a reference group, then yes, it’s possible that some of the customers who recently opened it took it away, but other factors could also cause a decline: opening of competitors’ outlets, macroeconomic conditions, local events (up to that the building opposite the store could start to be repaired), etc. All this must be taken into account in the mathematical model in order to correctly assess the degree of cannibalization.
Module 2 – RPM Analysis
This module allows you to predict the turnover of each potential store. A wide range of indicators is involved in the calculation: from the specifics of the location (address, floor in the shopping center, store area) to the number of households in the district, the composition of the brands of the shopping center, walking and car accessibility of the shopping center itself. The detail is high: for example, in new buildings, we take into account the stages of commissioning, class of housing, number of apartments, cost per square meter.
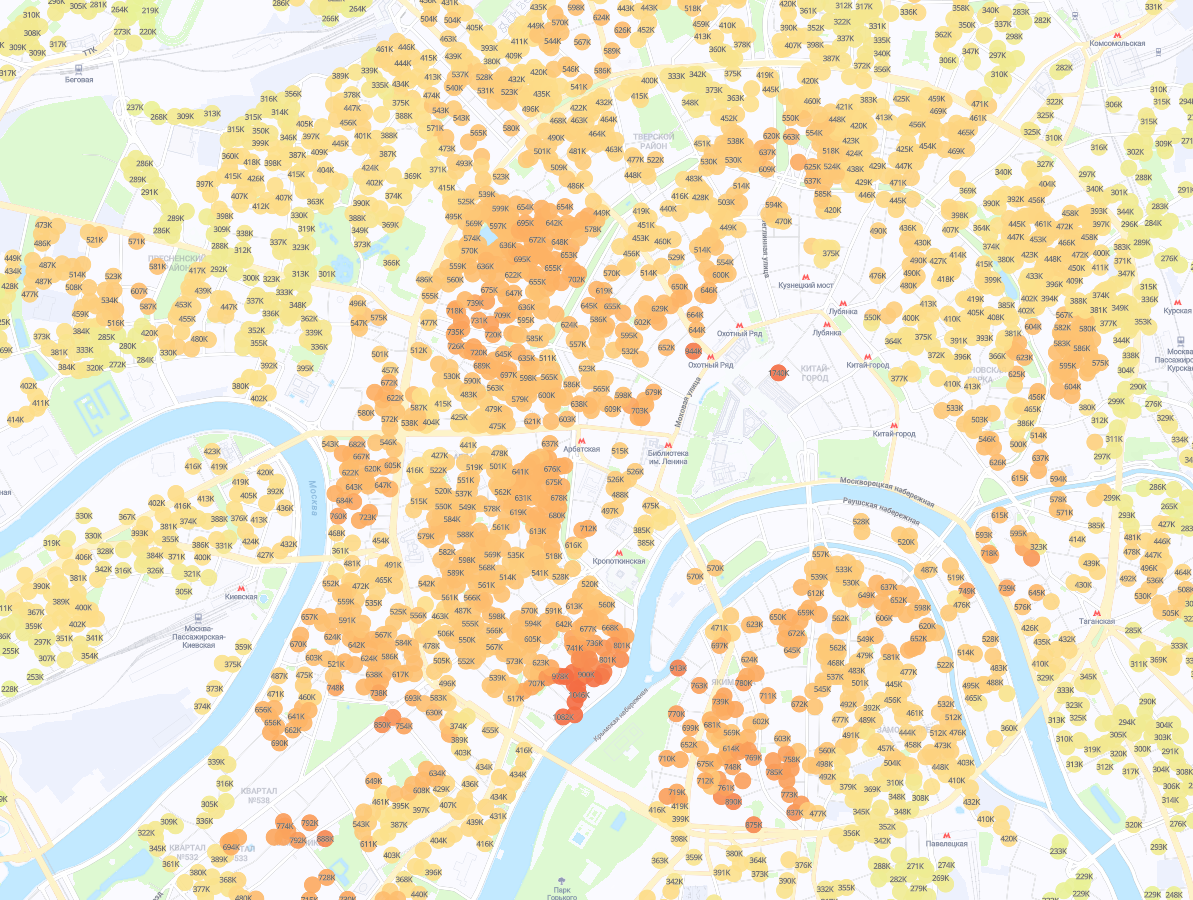
Household Income Card
Card with the number of apartments in houses
We check the estimated value of the turnover generated by the ML-algorithms with the estimates of our specialists in finance, retail sales and the development of the retail network and display final forecasts.
The heat map and turnover calculation modules helped us calculate incorrect information from some owners of the shopping center on traffic and coverage and, in general, increase the efficiency of decision-making on opening a new store.
We expect that with the introduction of GIS, the average error in forecasting the turnover of new stores will decrease by about half.
GIS is actively used in developing the Group’s expansion strategy. According to our estimates, the turnover of stores opened in accordance with the expansion strategy after evaluation in the GIS is on average 10-15% higher than when using only expert estimates.
In general, it is rather difficult to create a model that would work perfectly across Russia and give an equally low error for objects in different cities and locations. Therefore, while we check each result and manually confirm all GIS solutions, we also constantly improve its work.
To refuse manual checks, you must begin to trust the model. And this is possible only with positive results in several investment cycles (from the idea of opening a store to the first stable sales results): you need to make sure that the forecast was correct, and the error in comparison with the “human” estimate has decreased.
Module 3 – Opening Stores
Third module automates the workflow of opening stores. It aggregates information at all stages and allows in the “single window” mode to control the timing of each stage of the store opening. The module contains convenient dashboards with basic maps, forecasts, financial models and photos of the location and the object itself. So we systematized the data and completely transferred the investment committee to online.
In the future, we plan to finalize the module so that it allows you to track the timing, key steps and documents throughout the process: from creating an application to opening a store and conducting an audit on it.
New GIS modules – analysis of price preferences of buyers of already open points and the potential for the development of stores
We are finalizing two more modules that are still working in pilot mode.
The first is for analysis of those categories of goods that customers of a particular store prefer. About half of our goods are stored in stores, and the better we understand what people need in this place, the more efficient we will be able to build logistics and work with the assortment. All equipment can be roughly divided into five categories according to price and technical parameters: economy, basic, medium, premium and premium +. For example, people often go to a large store to choose large-sized equipment, and a small one serves as a “home store”, where they go to replace a broken teapot or smartphone case. We impose an analysis of the target audience, which GIS gives us, on the current assortment of stores and the level of sales. As a result, GIS allows you to evaluate possible customer requests and choose the most suitable range of products for customers. I note that we are talking about the assortment and not the prices – the same product in different stores is the same, we offer uniform prices, assortment and services online and in stores. That is why in any store that which is not on the shelf can be ordered online, we will bring it.
The second module is “Fair store potential.” With it, we determine how some open stores sag in revenue. For example, this may be a lack of local promotions, the specifics of staff, navigation in a shopping center, design or assortment of a store.
In addition, we compare the revenue dynamics of similar stores. If one of two stores with similar characteristics sags in turnover, we begin to analyze what factors can influence this.. The results of analytics form the basis of changes in the store – to reveal its “fair potential”.
New internal geoanalytics customers
GIS modules are used not only to assess the prospects of expansion. GIS is also used by colleagues from marketing, forming a local promo, commercial department to form and change the product range of stores.
GIS is also used by our data scientists. Geodata will allow colleagues from Data Science to build more accurate assortment and marketing models, plan pricing and promos.
We are constantly looking new data sources which would enrich our models, and intensively communicate with data providers. Next year we plan start systematically measuring traffic around the store, to understand what percentage of those who are at the store goes inside, and in the future to predict this ratio for new stores.
Map with pedestrian traffic
GIS and COVID-19
In connection with quarantine, we significantly changed our work, launched dozens of new projects. Since April 2020, the M.Video-Eldorado Group has completely switched to an online platform and has transformed into an online business. At the same time, stores remained an integral part of our online sales, a unique advantage: these were the points of online sales and courier delivery from stores, and the place of distribution of stocks. Their role is changing, but the importance for the ONE RETAIL ecosystem remains unchanged.
GIS, born for retail, was extremely useful for the development of online sales in a pandemic. Here are the main areas:
- Analytics of the coverage area of partner points of issue of orders (PVZ).
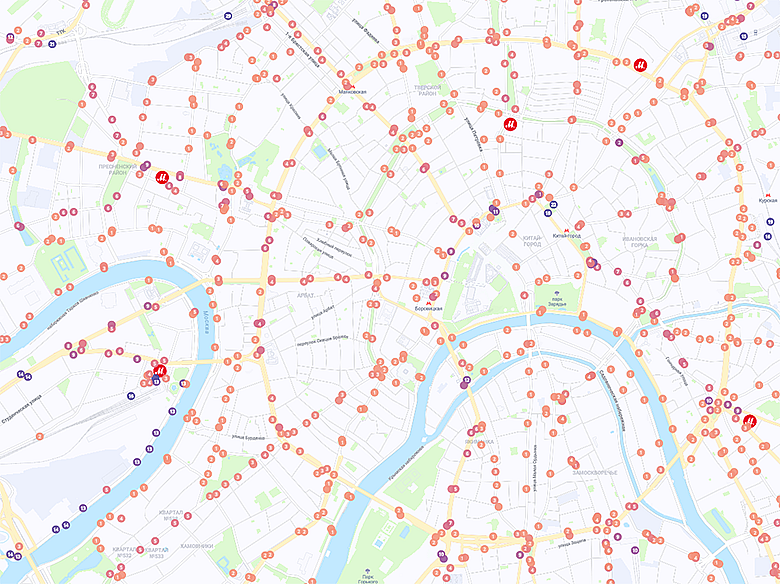
The M.Video-Eldorado Group began to collaborate with the X5 Retail Group and the Russian Post on the self-delivery of M.Video and Eldorado online orders from Pyaterochka stores and post offices. GIS provides an opportunity to analyze the zones of walking and automobile accessibility of these PVZs and select those locations that are the most remote from the coverage areas of our open stores, increasing the efficiency and effectiveness of the “last mile”.
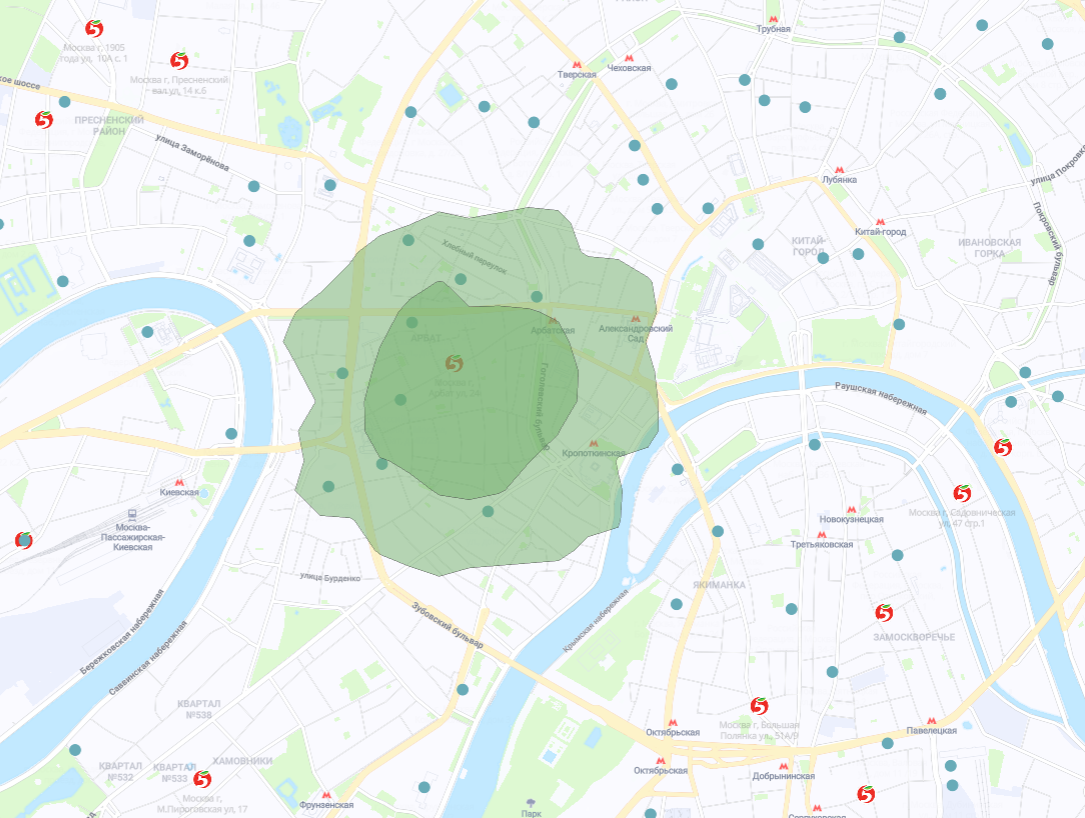
Map with PVZ coverage areas
- Increase the efficiency of the location of goods in stores.
Due to the analysis of sales and stocks, the Group plans to improve the assortment of stores and provide customers with a wide selection of the most suitable products. Also, with the introduction of video consultations in stores, M.Video and Eldorado sellers will be able to display the most relevant positions in stores, improving the user’s online path.