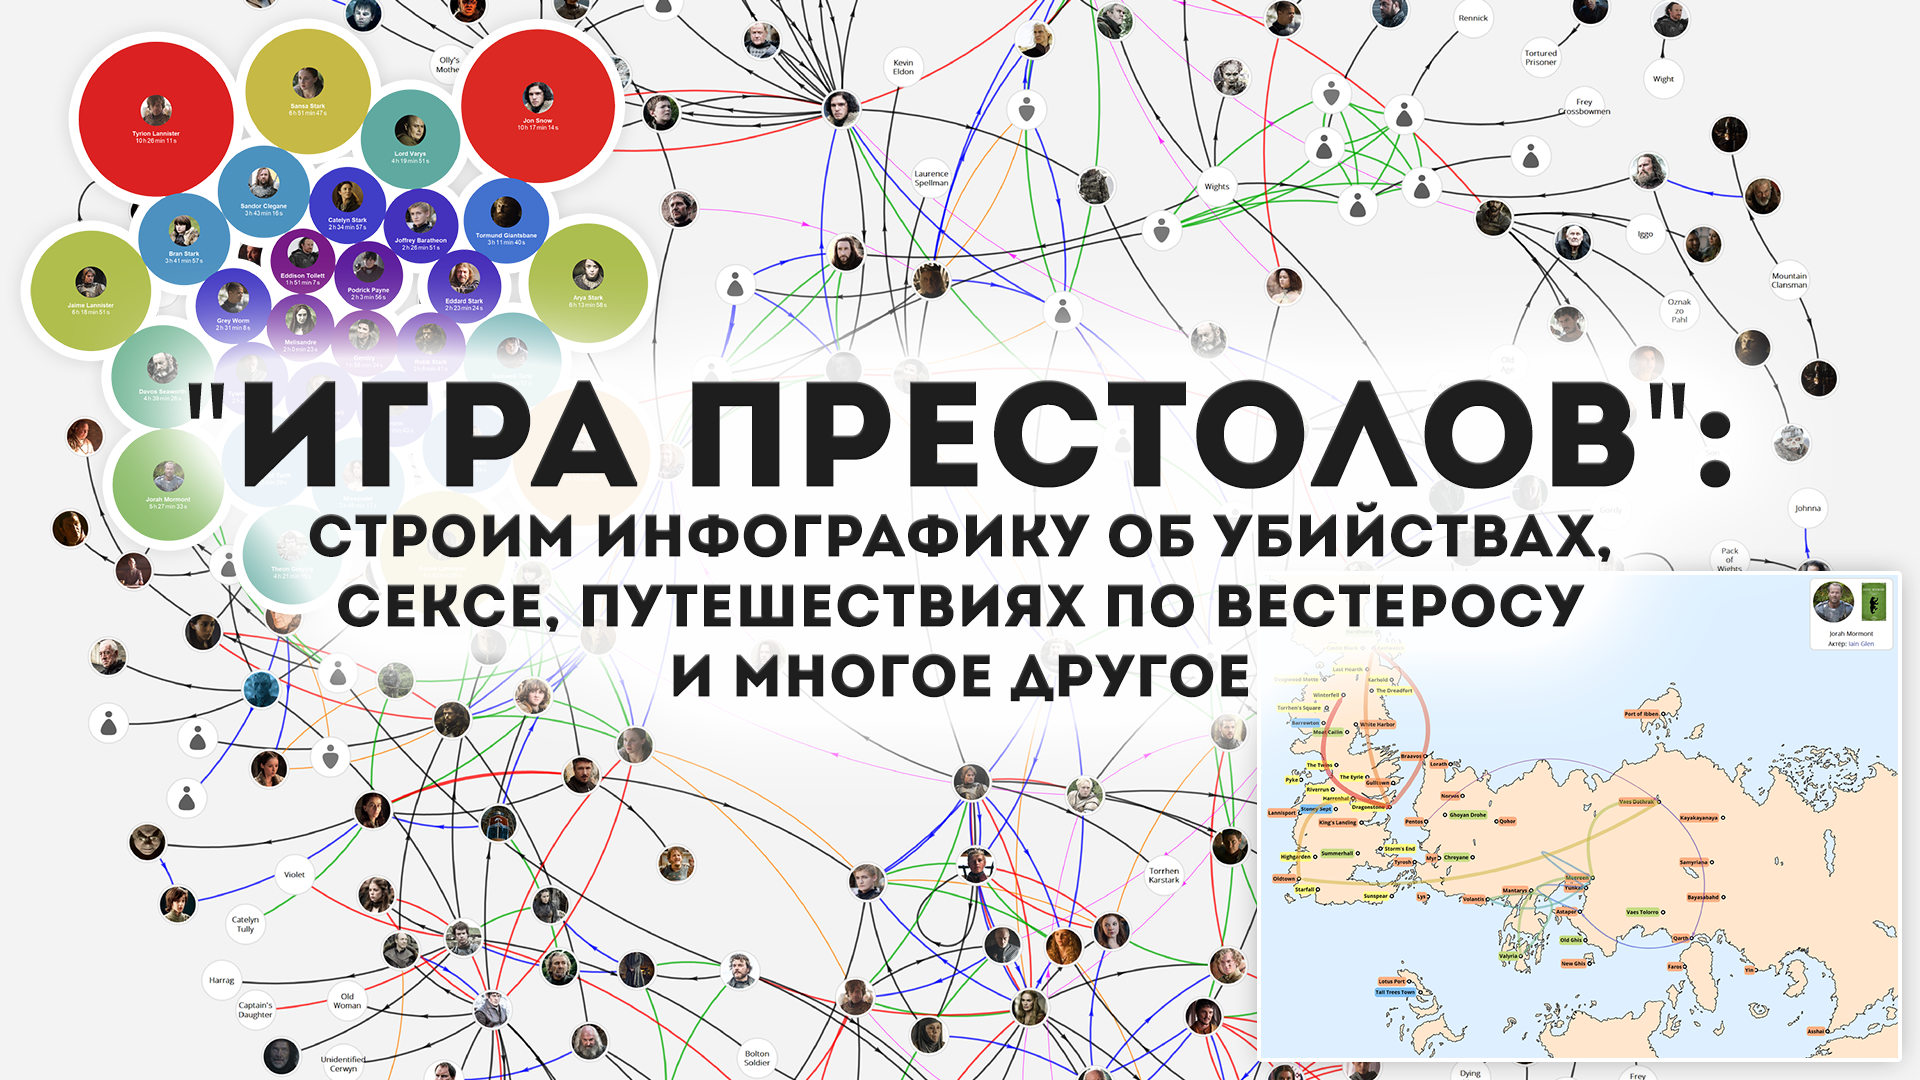
"Game of Thrones": building an infographic about murders, sex, traveling around Västerås and much more
Original post + Auxiliary functions and source data
Table of contents
Character Relationships
– Who bore whom
– who to whom brother or sister
– Who killed whom
– Who serves whom?
– Who is married to or engaged to
– Who had sex with anyone
– All relationships on one graph
Character contact by scenes
Who is the most "popular" character of the Game of Thrones?
– The amount of screen time for characters
– How many characters were in the series?
– Which of the characters was the largest number of the Game of Thrones series?
The most popular “Game of Thrones” locations
– Map of locations "Game of Thrones"
– Moving the characters "Game of Thrones" from series to series
– Who is the most "traveled" from the characters of "Game of thrones"?
– The most popular “Game of Thrones” locations (on screen time)
In which films have the actors of the Game of Thrones played and how familiar are they?
– Films in which the most “sought-after” actors of “Game of Thrones” played:
– Actors "Game of Thrones" in "Harry Potter"
– Actors "Game of Thrones" in "Star Wars"
– Actors "Game of Thrones" in "Pirates of the Caribbean"
– In which films / series there are many actors of the Game of Thrones
– How are the actors of the Game of Thrones closely intertwined?
Talk in the "Game of Thrones"
Gender of the characters of the Game of Thrones: who is more, men or women?
In this post I will talk about how to use the Wolfram Languge language in analyzing and visualizing data using the Game of Thrones database as an example. This article does not pay much attention to data parsing, I will talk about this separately. Instead, the post is entirely devoted to interesting infographics and its creation.
I hope that the built visualizations will interest those who like this wonderful series).
The infographics created for the post is interactive in the Mathematica document, which can be downloaded from the link in the header.
Character relationships
The set of edges of the relationship of characters by type:
$ GOTCharacterLinks =
    Module[{parser},
        parser=
            Flatten[
                Thread/@
                    DeleteCases[
                        Lookup[
                            GOTRawData["characters.json"][
                                "characters"
                            ],
                            {"characterName", #}
                        ],
                        {_, _ Missing}
                    ],
                one
            ]&;        <|
        "РодительИРебёнок"
        ->
        Union[
            DirectedEdge[#[[2]]That[[1]]]& / @ parser["parents"],
            DirectedEdge[#[#[[1]]That[[2]]]& / @ parser["parentOf"]
        ],
        "Brothers and sisters"
        ->
        DeleteDuplicates[
            UndirectedEdge[#[#[[2]]That[[1]]]& / @ parser["siblings"],
            # 1 === Reverse[#2]&
        ],
        "Killed" ->
            Union[
                DirectedEdge[#[#[[2]]That[[1]]]& / @ parser["killedBy"],
                DirectedEdge[#[#[[1]]That[[2]]]& / @ parser["killed"]
            ],
        "Serves" -> (DirectedEdge[#[#[[1]]That[[2]]]& / @ parser["serves"]),
        "MarriedTroubs"
        ->
        DeleteDuplicates[
            UndirectedEdge[#[#[[1]]That[[2]]]& / @ parser["marriedEngaged"],
            # 1 === Reverse[#2]&
        ],
        "Sex" ->
            DeleteDuplicates[
                Flatten[
                    Map[
                        Thread @ UndirectedEdge[#[#[[1]]That[[2]]["with"]]&,
                        Lookup[#,{"name","sex"}]& / @
                            Select[
                                Select[
                                    Flatten[
                                        Lookup[
                                            Flatten[
                                                GOTRawData[
                                                    "episodes.json"
                                                ][
                                                    "episodes"
                                                ][
                                                    [;;,"scenes"]

                                                ],
                                                one
                                            ],
                                            "characters"
                                        ]],
                                    Keys[#]=! = {"name"} &
                                ],
                                MemberQ[Keys[Keys[#], "sex"]&
                            ]]],
                # 1 === Reverse[#2]&
            ]|>
    ];
Function GOTCharacterLinksGraph to build graphs of the relationship of characters "Game of Thrones".
ClearAll[GOTCharacterLinksGraph];
GOTCharacterLinksGraph[
data_,
OptionsPattern[
{
"ImageSize"->1500,
"VertexSize"->Automatic,
"GraphLayout"->"GravityEmbedding"
}
]
]: =
Module[{vertexList},
vertexList=
DeleteDuplicates[Flatten[data[[;;,1]]/._[x_,y_]:> {x, y}]];
Graph[
data,
VertexLabels->
Map[
Rule[
#,
Placed[
Tooltip[
If[
Head[#]=== Image,
Image[#,ImageSize->60],
(* else *)
Style[
StringReplace[#," "->"n"],
LineSpacing -> {0.8,0,0},
FontFamily -> "Open Sans Light",
Bold
12
]]&[
#/.$characterImage
],
# /. $ characterCardFull
],
{1 / 2.1 / 2}
]]&,
vertexList
],
VertexShapeFunction -> "Circle",
VertexSize-> OptionValue["VertexSize"],
VertexStyle->
Directive[
{White,EdgeForm[{LightGray,AbsoluteThickness[2]}]}
],
ImageSize-> OptionValue["ImageSize"],
Background-> GrayLevel[0.95],
AspectRatio-> 1,
GraphLayout-> OptionValue["GraphLayout"]
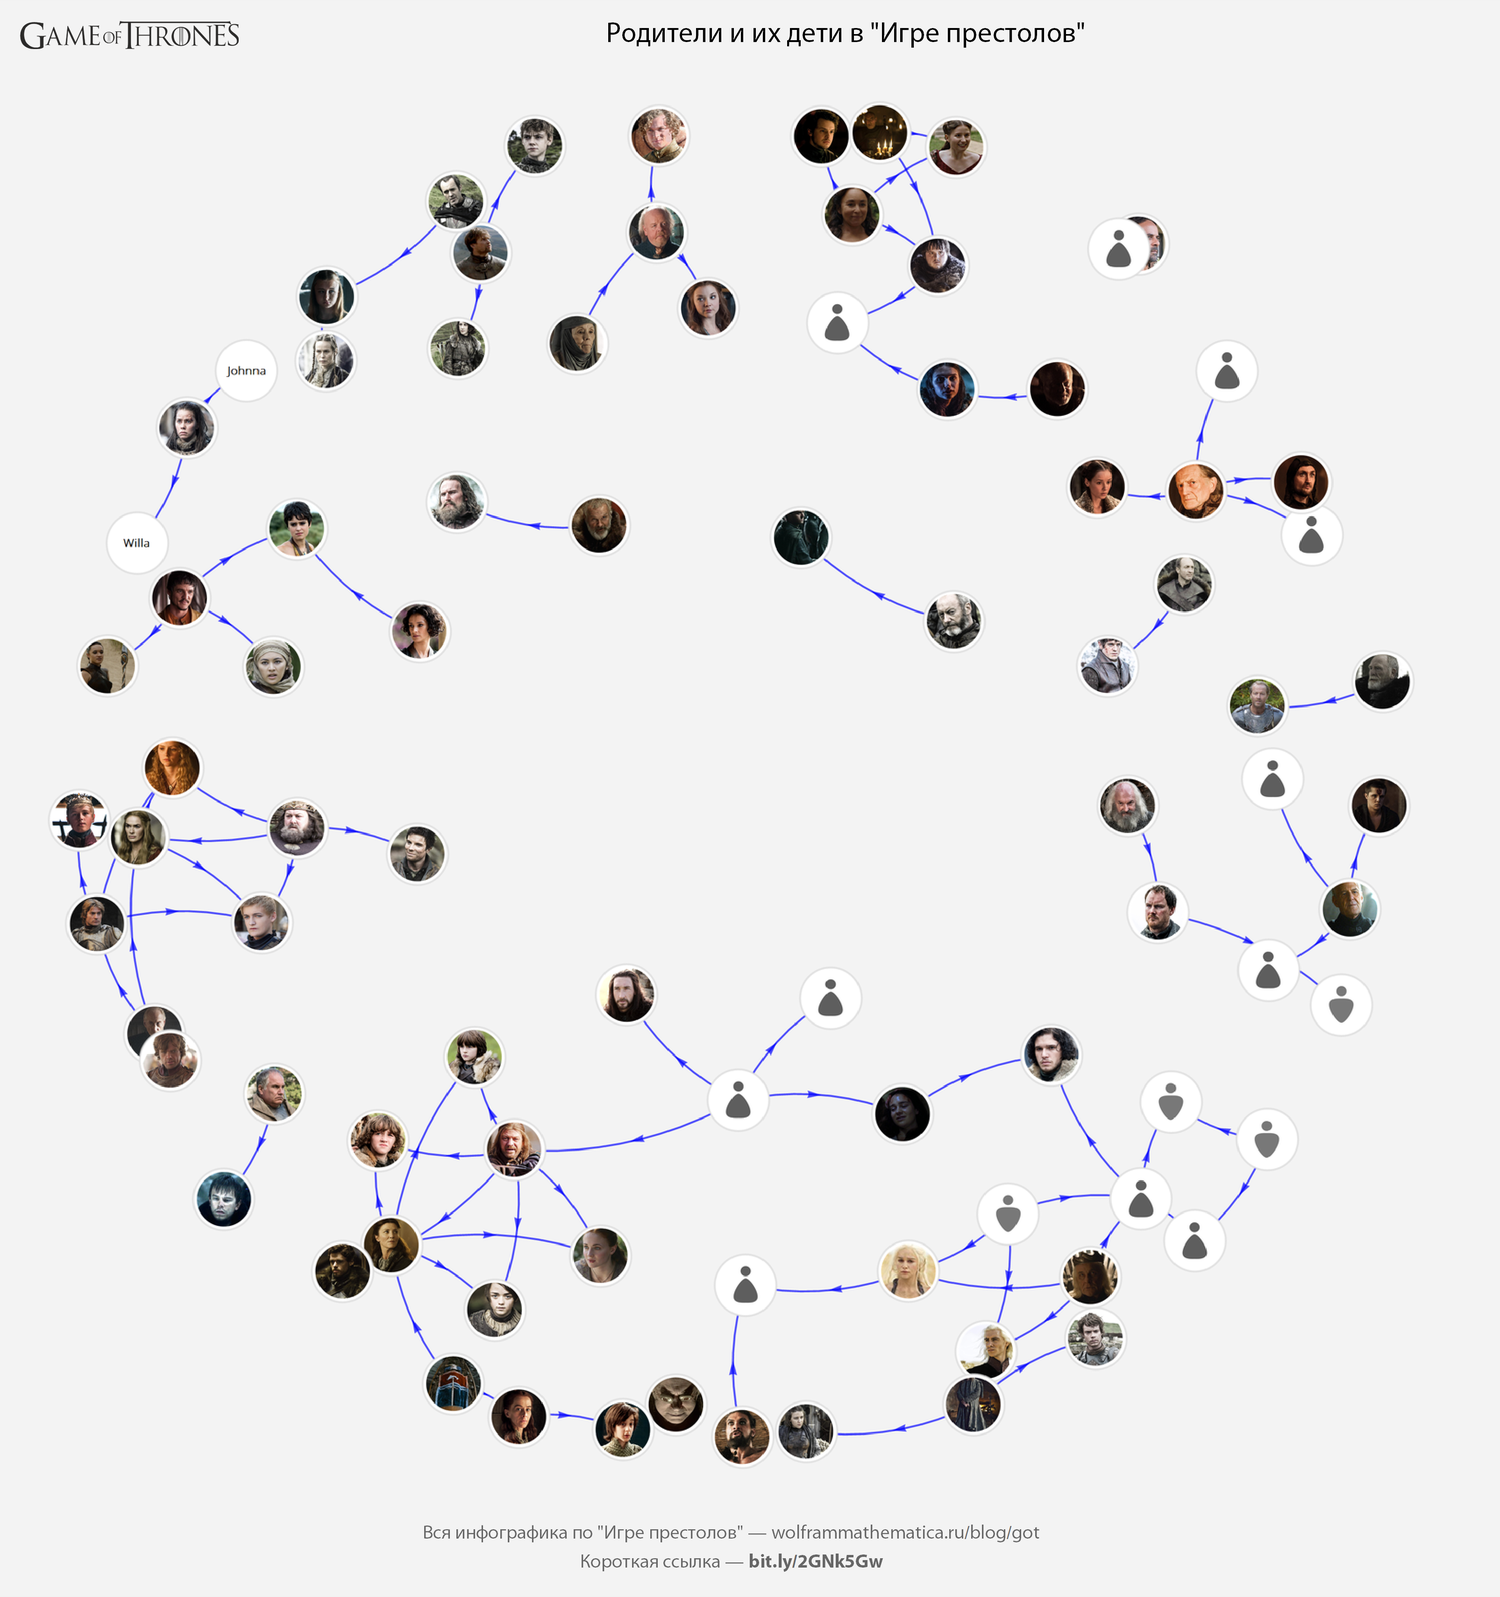
]];We find out who bore whom in the Game of Thrones:
GOTInfographicsPoster[
       #, "Родители и их дети в "Игре престолов"",
   "ImageSize" -> 1500
   ] & @
     GOTCharacterLinksGraph[
          Property[
                 #,
                 {
                      EdgeStyle ->
                           Directive[
                                {
                                     AbsoluteThickness[2],
                                     Blue,
                                     Arrowheads[{0, {0.01, 0.5}}]
                                 }
                            ]}
             ]& / @
               $ GOTCharacterLinks["РодительИРебёнок"],
          "VertexSize" -> 3
      ]
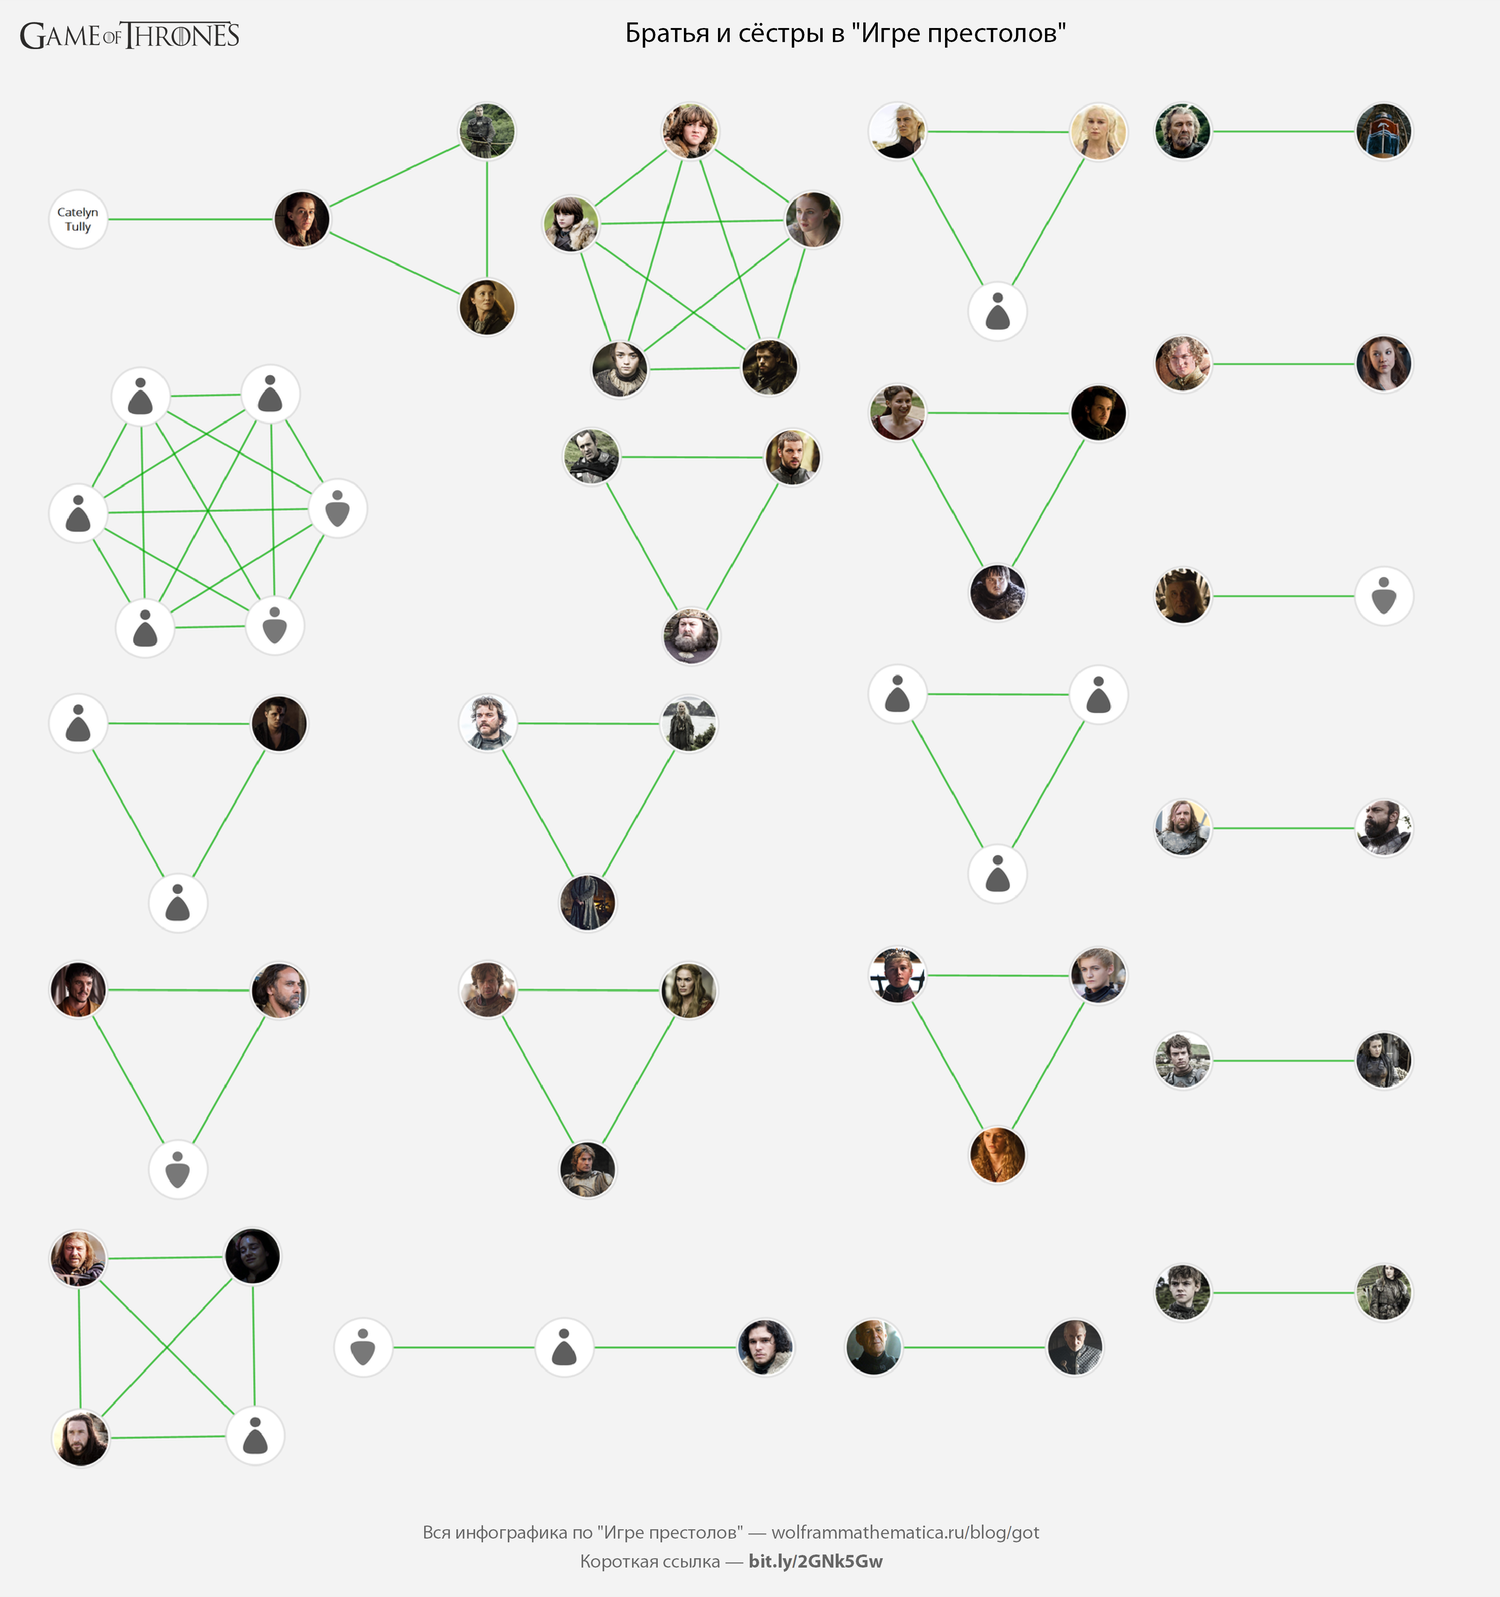
Now let's see who is a brother or sister to the Game of Thrones:
GOTInfographicsPoster[
    #,"Братья и сёстры в "Игре престолов"","ImageSize"->1500
]& @
    GOTCharacterLinksGraph[
        Property[
            #,
            {EdgeStyle->Directive[{AbsoluteThickness[2], Darker @ Green}]}
        ]& / @
            $ GOTCharacterLinks["БратьяИСёстры"],
        "VertexSize" -> 0.7,
        "GraphLayout" -> Automatic
    ]
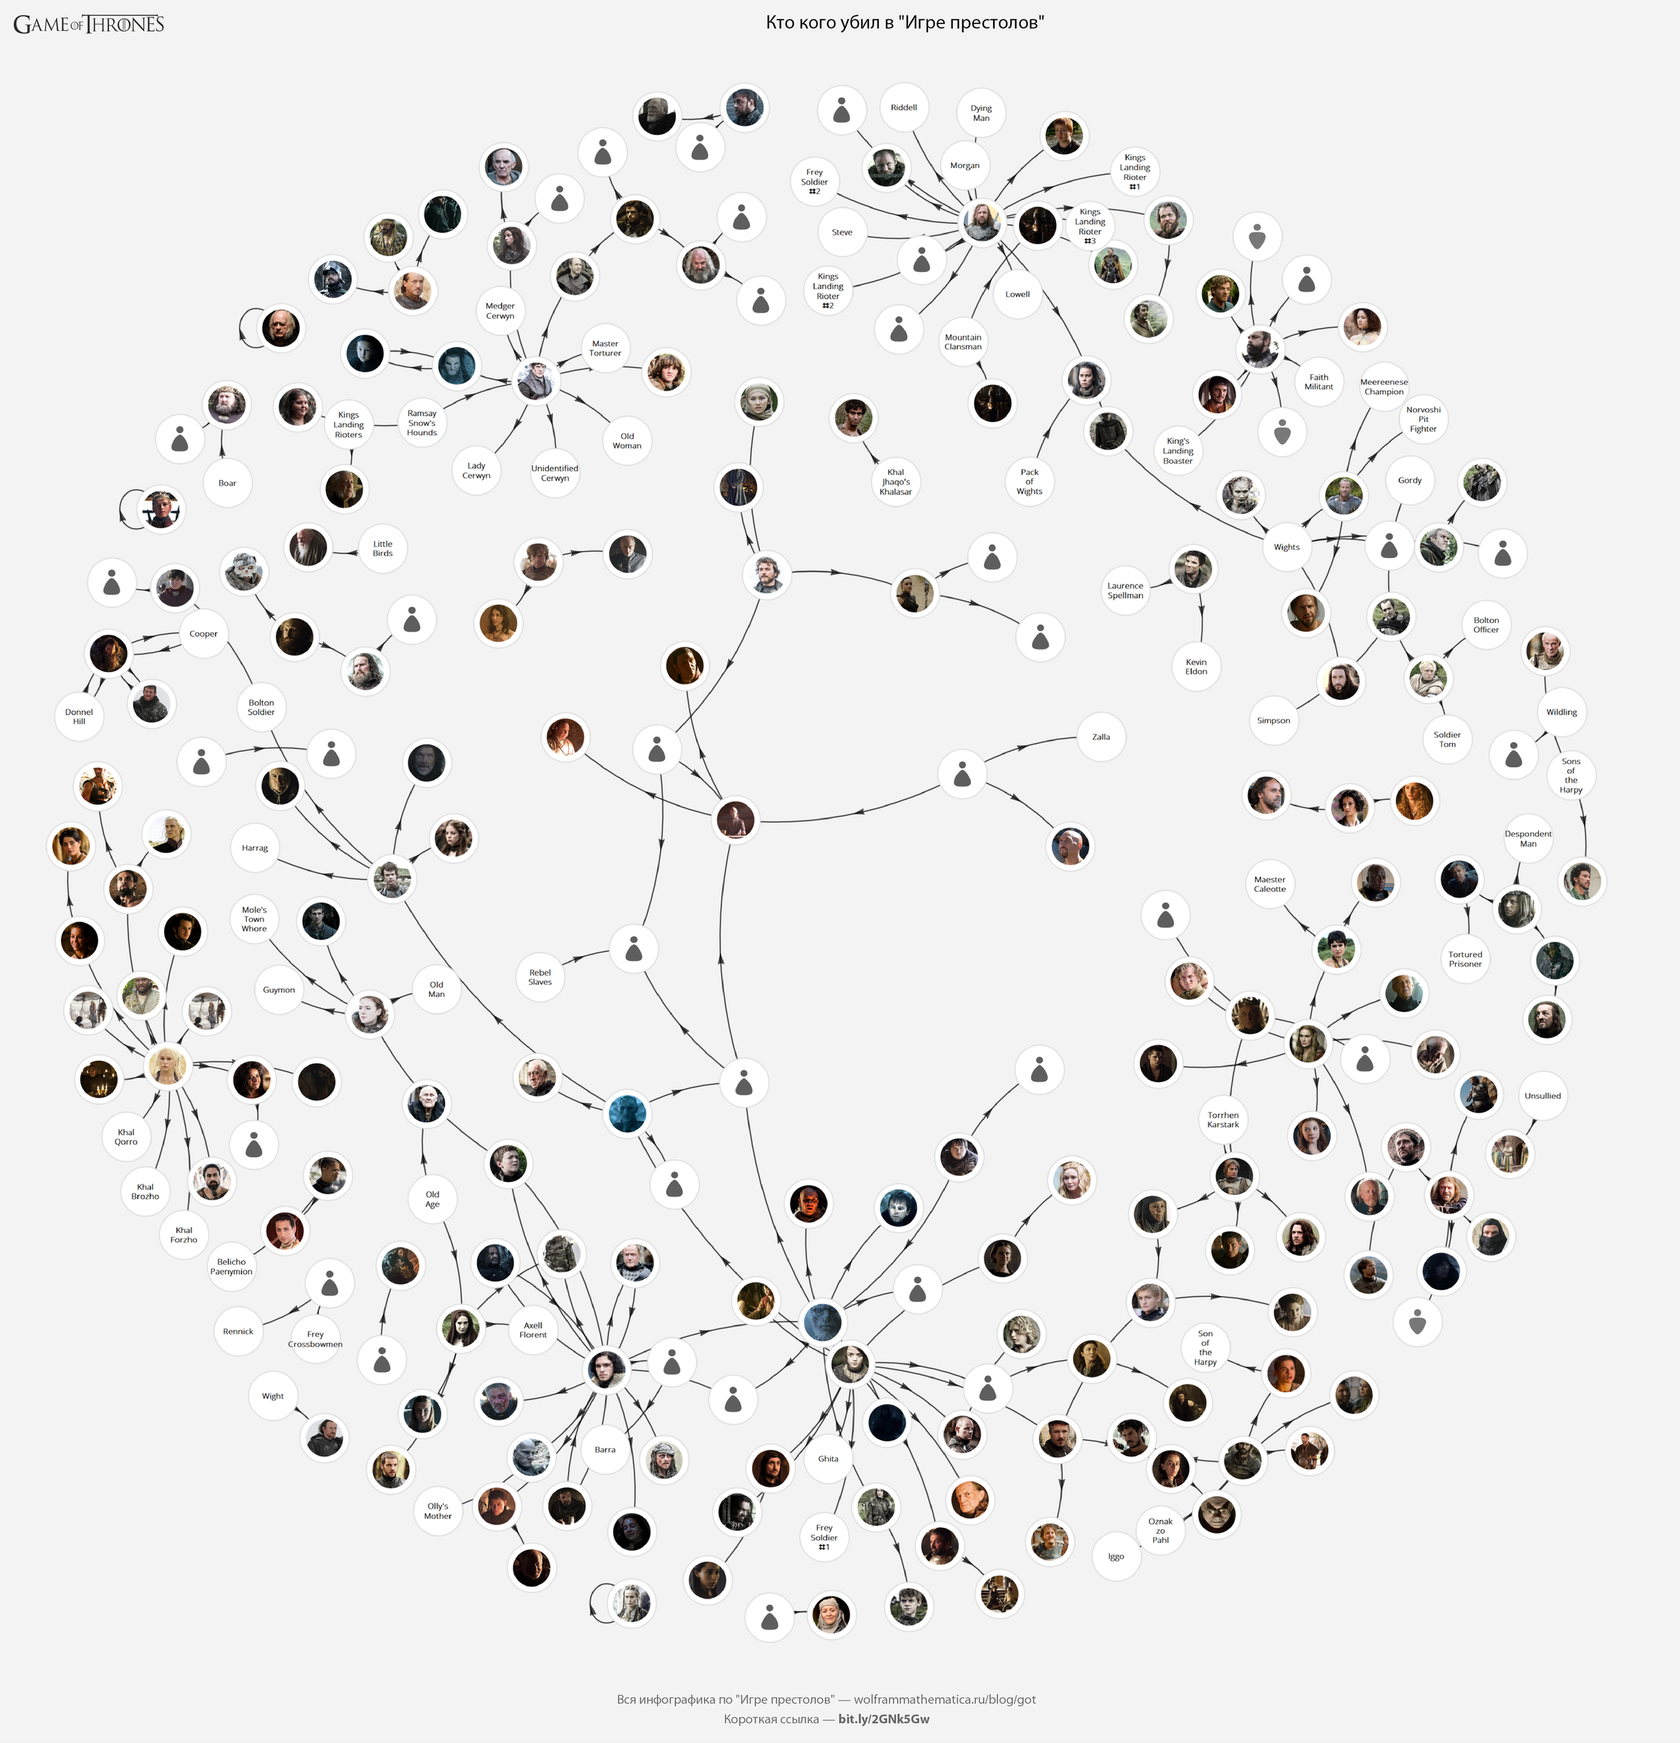
One of the most interesting: the count of murders in the "Game of Thrones":
GOTInfographicsPoster[
    #,"Кто кого убил в "Игре престолов"","ImageSize"->2500
]& @
    GOTCharacterLinksGraph[
        Property[
            #,
            {
                EdgeStyle->
                    Directive[
                        {
                            AbsoluteThickness[2],
                            Black,
                            Arrowheads[{0,{0.0075,0.5}}]
                        }
                    ]}
        ]& / @
            $ GOTCharacterLinks["Убил"],
        "VertexSize" -> 1.1,
        "ImageSize" -> 2500
    ]
(original)
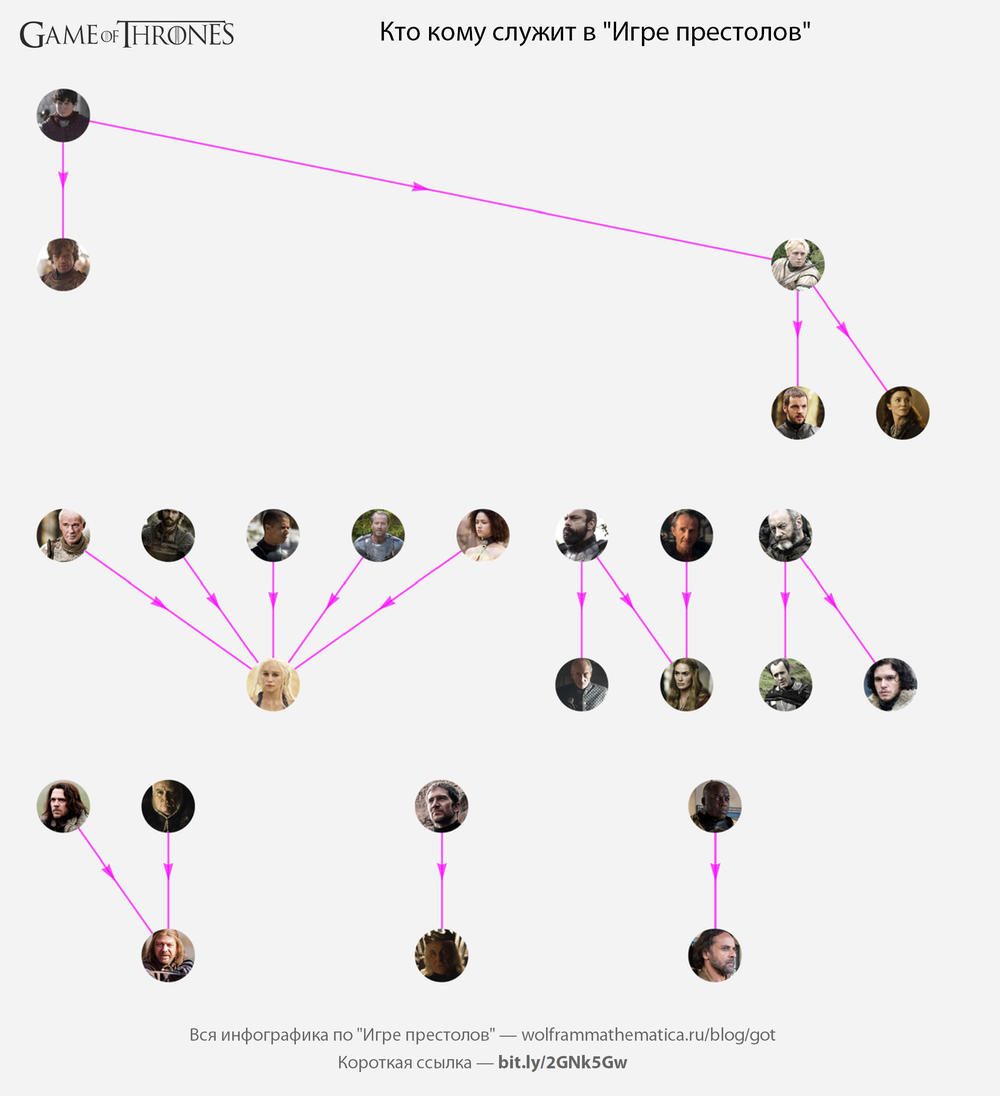
Not so interesting, but nevertheless – who serves whom to the “Game of Thrones”:
GOTInfographicsPoster[
    #,"Кто кому служит в "Игре престолов"","ImageSize"->1000
]& @
    GOTCharacterLinksGraph[
        Property[
            #,
            {
                EdgeStyle->
                    Directive[
                        {
                            AbsoluteThickness[2],
                            Magenta
                            Arrowheads[{0,{0.02,0.5}}]
                        }
                    ]}
        ]& / @
            $ GOTCharacterLinks["Служит"],
        "VertexSize" -> 0.5,
        "ImageSize" -> 1000,
        "GraphLayout" -> Automatic
    ]
Engaged and married characters of Game of Thrones:
GOTInfographicsPoster[
    #,
    "Кто с кем женат или обручен в "Игре престолов"",
    "ImageSize"->1000
]& @
    GOTCharacterLinksGraph[
        Property[
            #,{EdgeStyle->Directive[{AbsoluteThickness[2], Orange}]}
        ]& / @
            $ GOTCharacterLinks["ЖенатыОбручены"],
        "VertexSize" -> 0.5,
        "ImageSize" -> 1000,
        "GraphLayout" -> Automatic
    ]
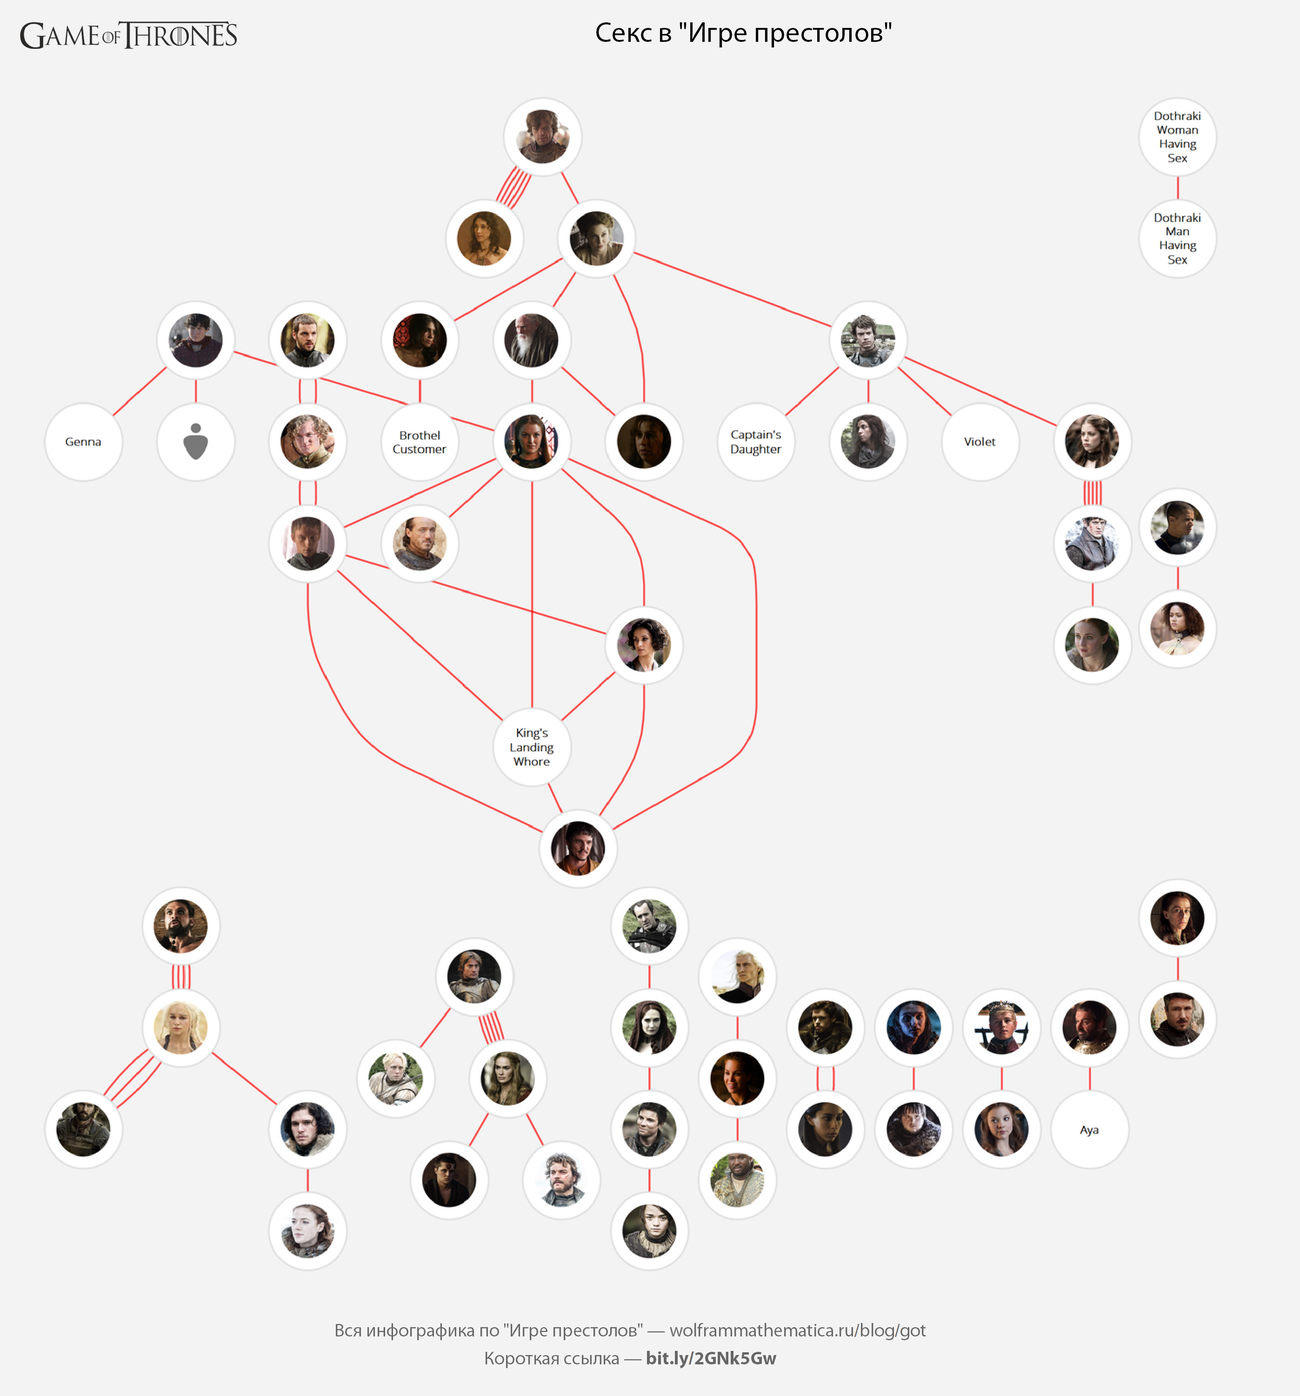
A little hotter – who had sex with someone in Game of Thrones (the number of lines, I think, is not difficult to guess what it means;)).
GOTInfographicsPoster[#, "Секс в "Игре престолов"",
   "ImageSize" -> 1300] & @
     GOTCharacterLinksGraph[

  Property[#, {EdgeStyle ->
       Directive[{AbsoluteThickness[2], Red}]}]& / @
               $ GOTCharacterLinks["Секс"],
          "VertexSize" -> 0.9,
          "ImageSize" -> 1300,
          "GraphLayout" -> "LayeredDigraphEmbedding"
      ]
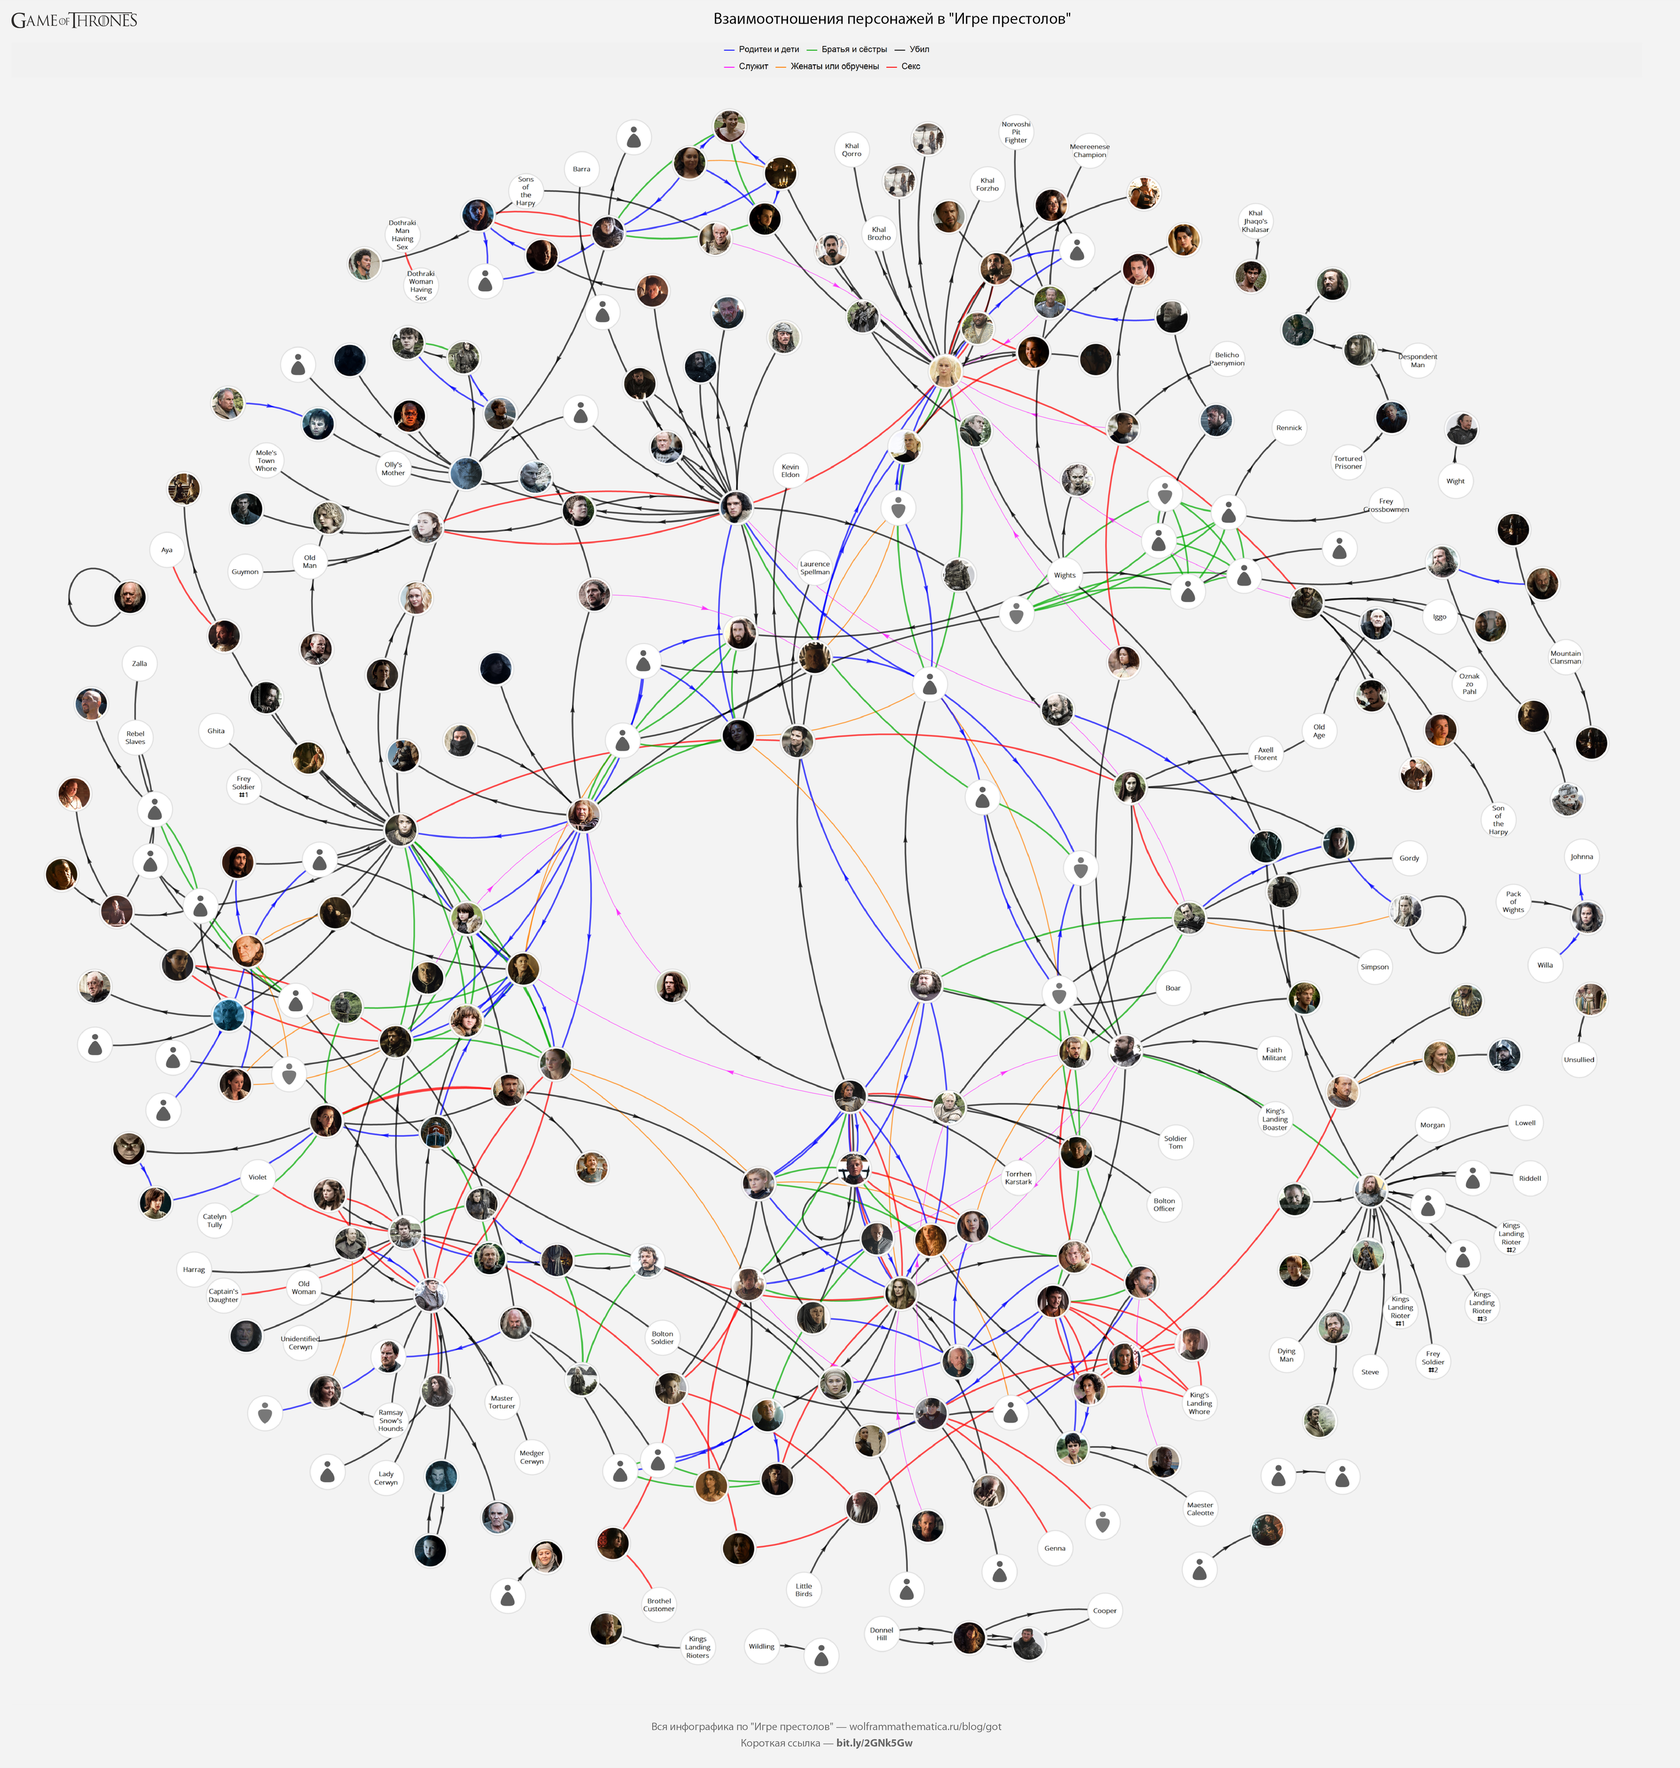
Now let's put all the graphs in one big graph of the relationship of characters in the “Game of Thrones”:
GOTInfographicsPoster[
    #,
    "Взаимоотношения персонажей в "Игре престолов"",
    "ImageSize"->3000
]& @
    Legended[
        GOTCharacterLinksGraph[
            Join[
                Property[
                    #,
                    {
                        EdgeStyle->
                            Directive[
                                {
                                    AbsoluteThickness[3],
                                    Blue,
                                    Arrowheads[{0,{0.005,0.5}}]
                                }
                            ]}
                ]& / @
                    $ GOTCharacterLinks["РодительИРебёнок"],
                Property[
                    #,
                    {
                        EdgeStyle->
                            Directive[
                                {AbsoluteThickness[3], Darker @ Green}
                            ]}
                ]& / @
                    $ GOTCharacterLinks["БратьяИСёстры"],
                Property[
                    #,
                    {
                        EdgeStyle->
                            Directive[
                                {
                                    AbsoluteThickness[3],
                                    Black,
                                    Arrowheads[{0,{0.005,0.5}}]
                                }
                            ]}
                ]& / @
                    $ GOTCharacterLinks["Убил"],
                Property[
                    #,
                    {
                        EdgeStyle->
                            Directive[
                                {
                                    AbsoluteThickness[1],
                                    Magenta
                                    Arrowheads[{0,{0.005,0.5}}]
                                }
                            ]}
                ]& / @
                    $ GOTCharacterLinks["Служит"],
                Property[
                    #,
                    {
                        EdgeStyle->
                            Directive[{AbsoluteThickness[2], Orange}]}
                ]& / @
                    $ GOTCharacterLinks["ЖенатыОбручены"],
                Property[
                    #,
                    {EdgeStyle->Directive[{AbsoluteThickness[3], Red}]}
                ]& / @
                    DeleteDuplicates[$GOTCharacterLinks[$GOTCharacterLinks["Секс"]]],
            "ImageSize" -> 3000,
            "VertexSize" -> 0.9
        ],
        Placed[
            LineLegend[
                {Blue,Darker@Green,Black,Magenta,Orange,Red},
                {
                    "Родитеи и дети",
                    "Братья и сёстры",
                    "Убил",
                    "Служит",
                    "Женаты или обручены",
                    "Секс"
                },
                LegendLayout->"Row"
            ],
            Top
        ]]
(original)
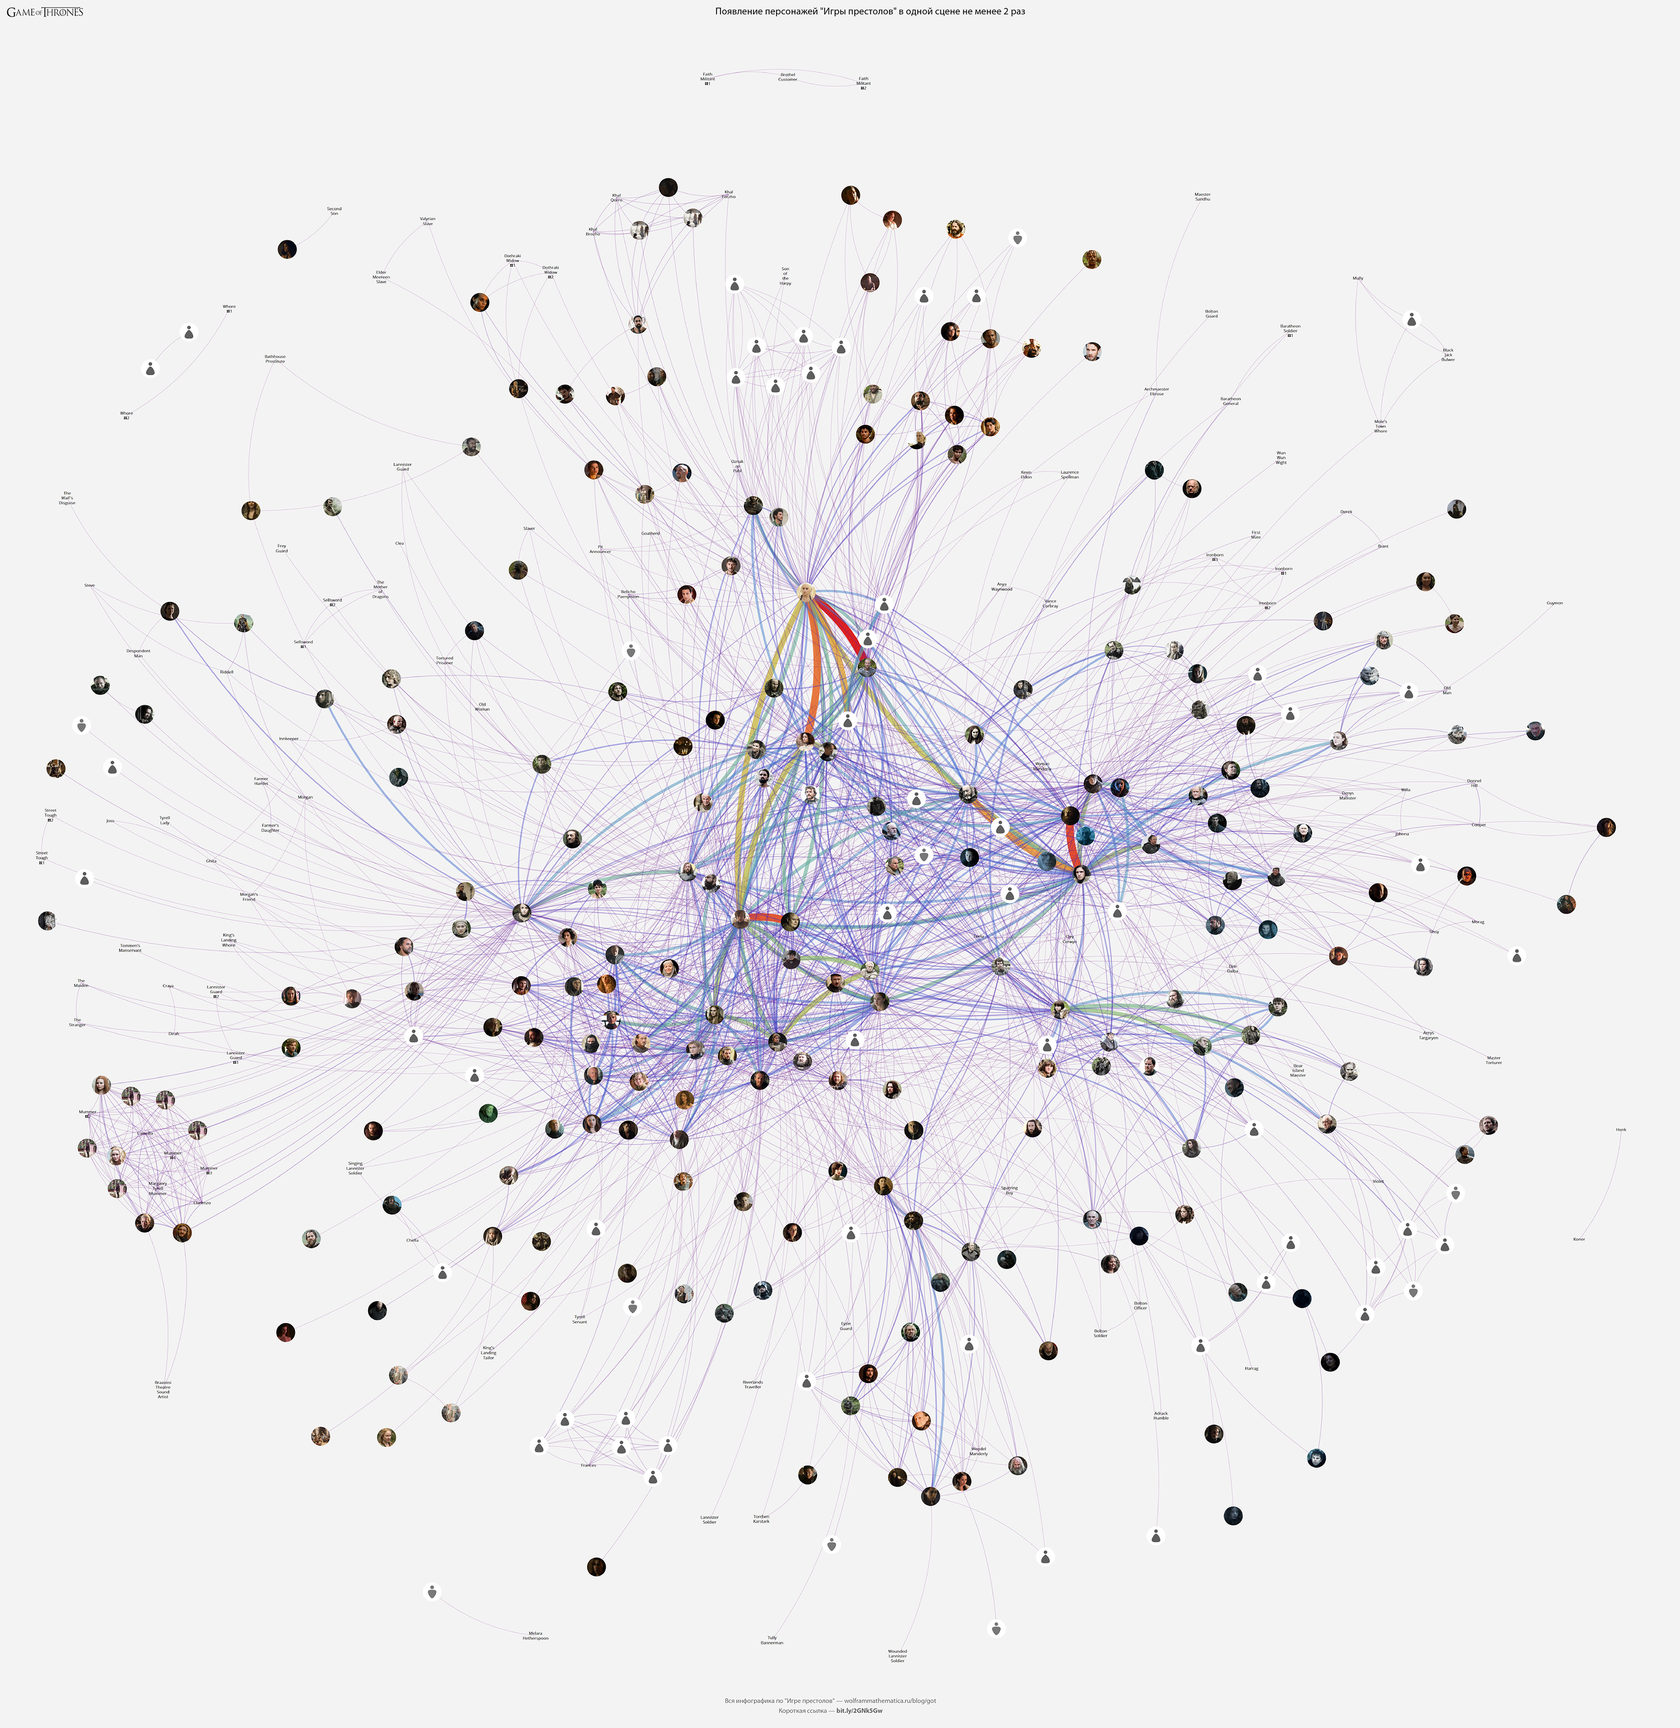
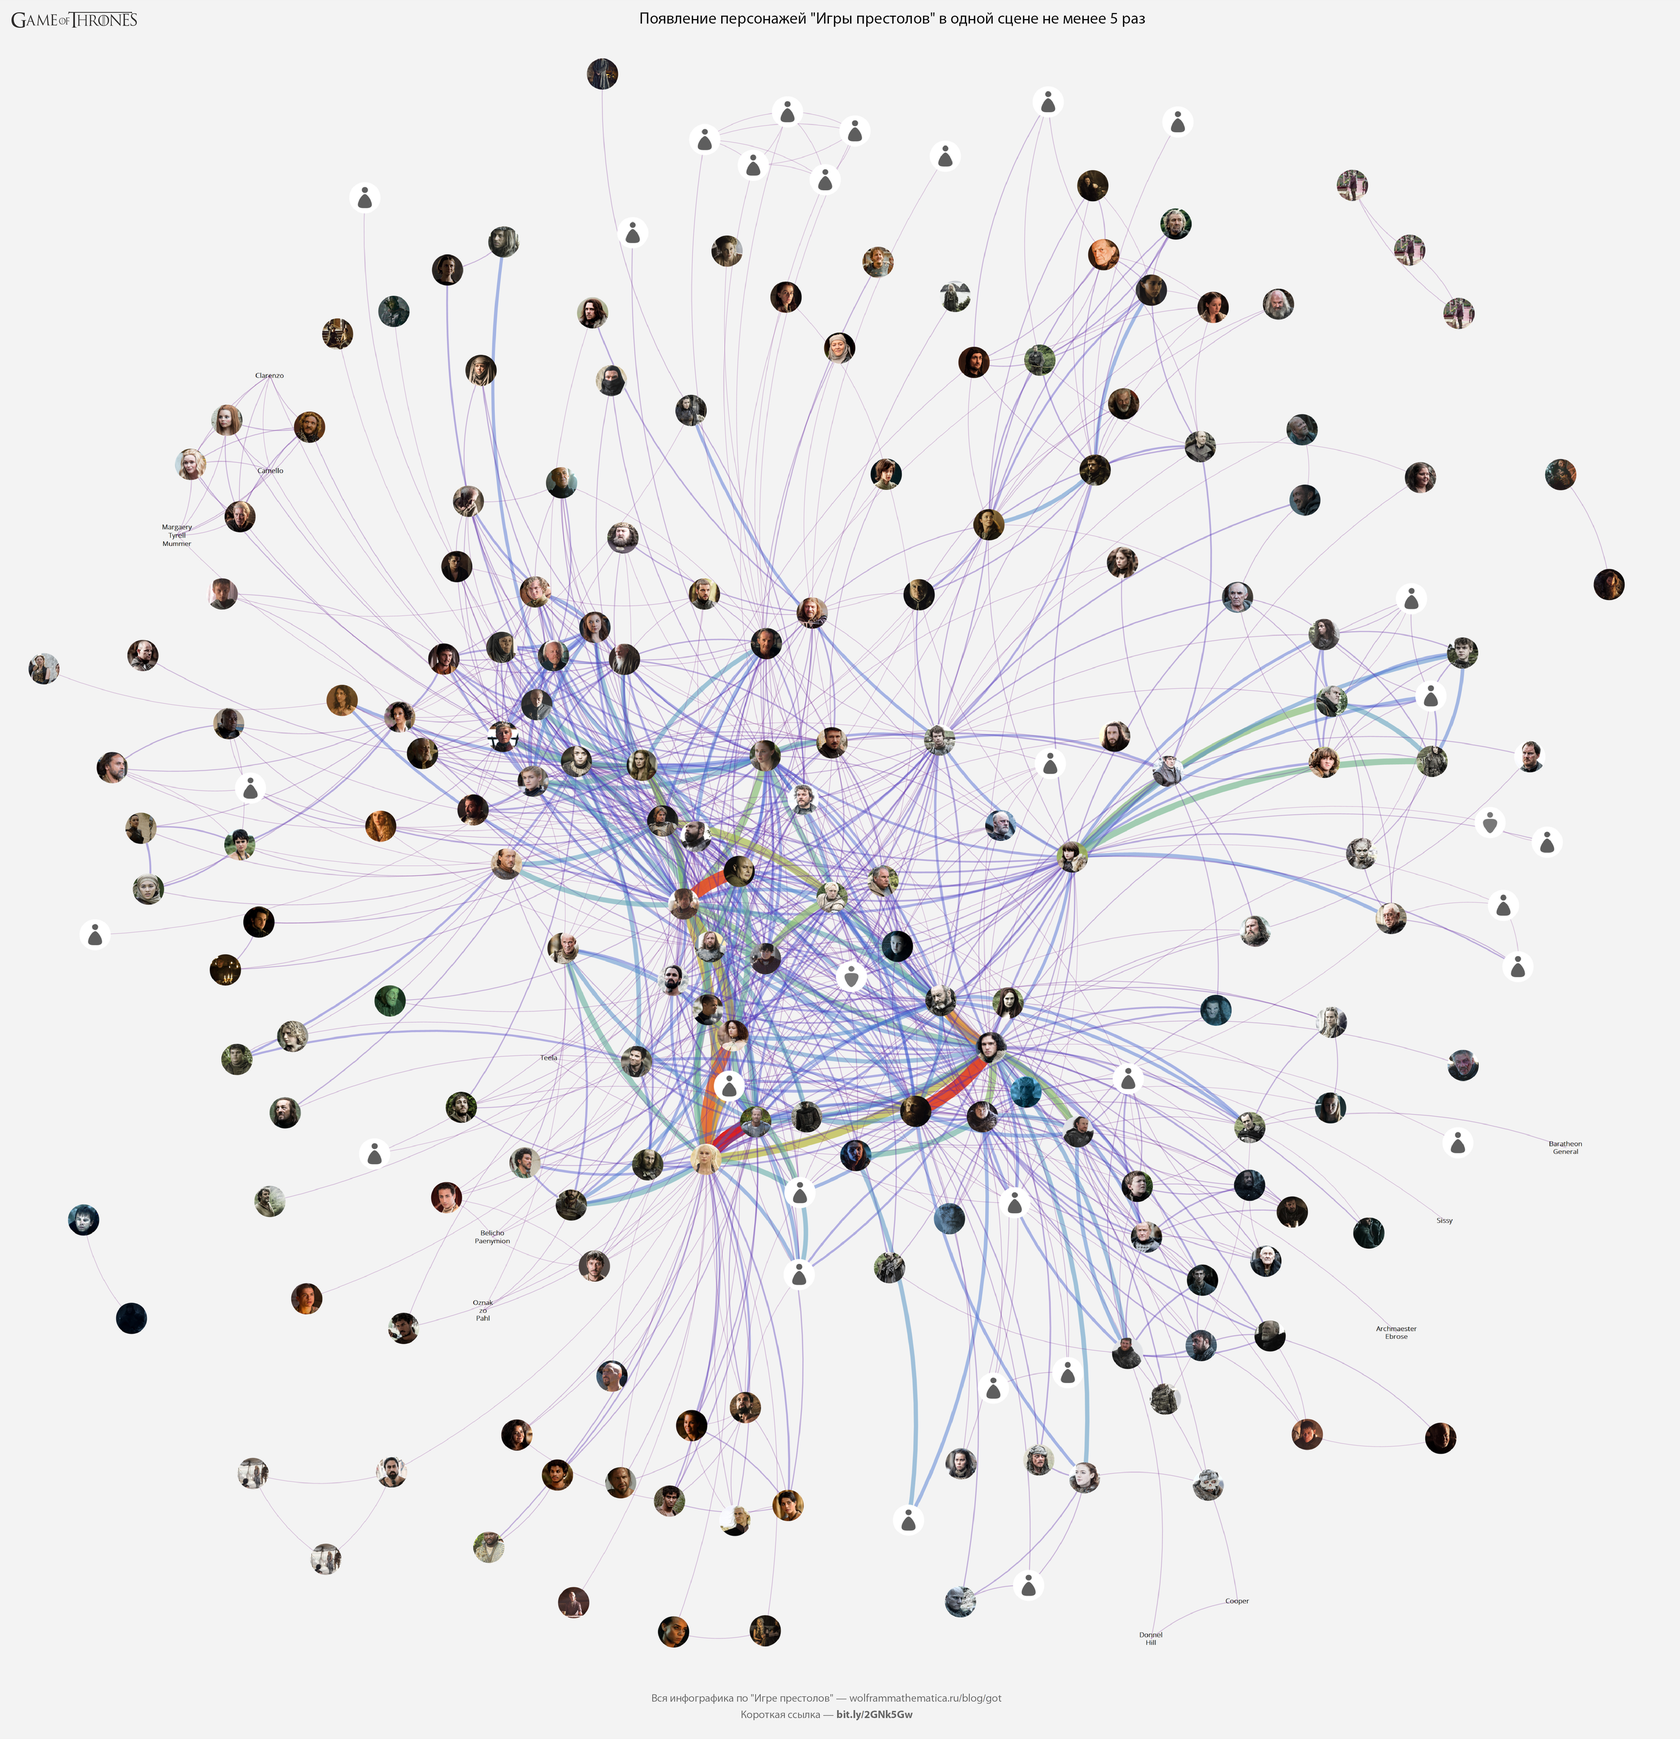
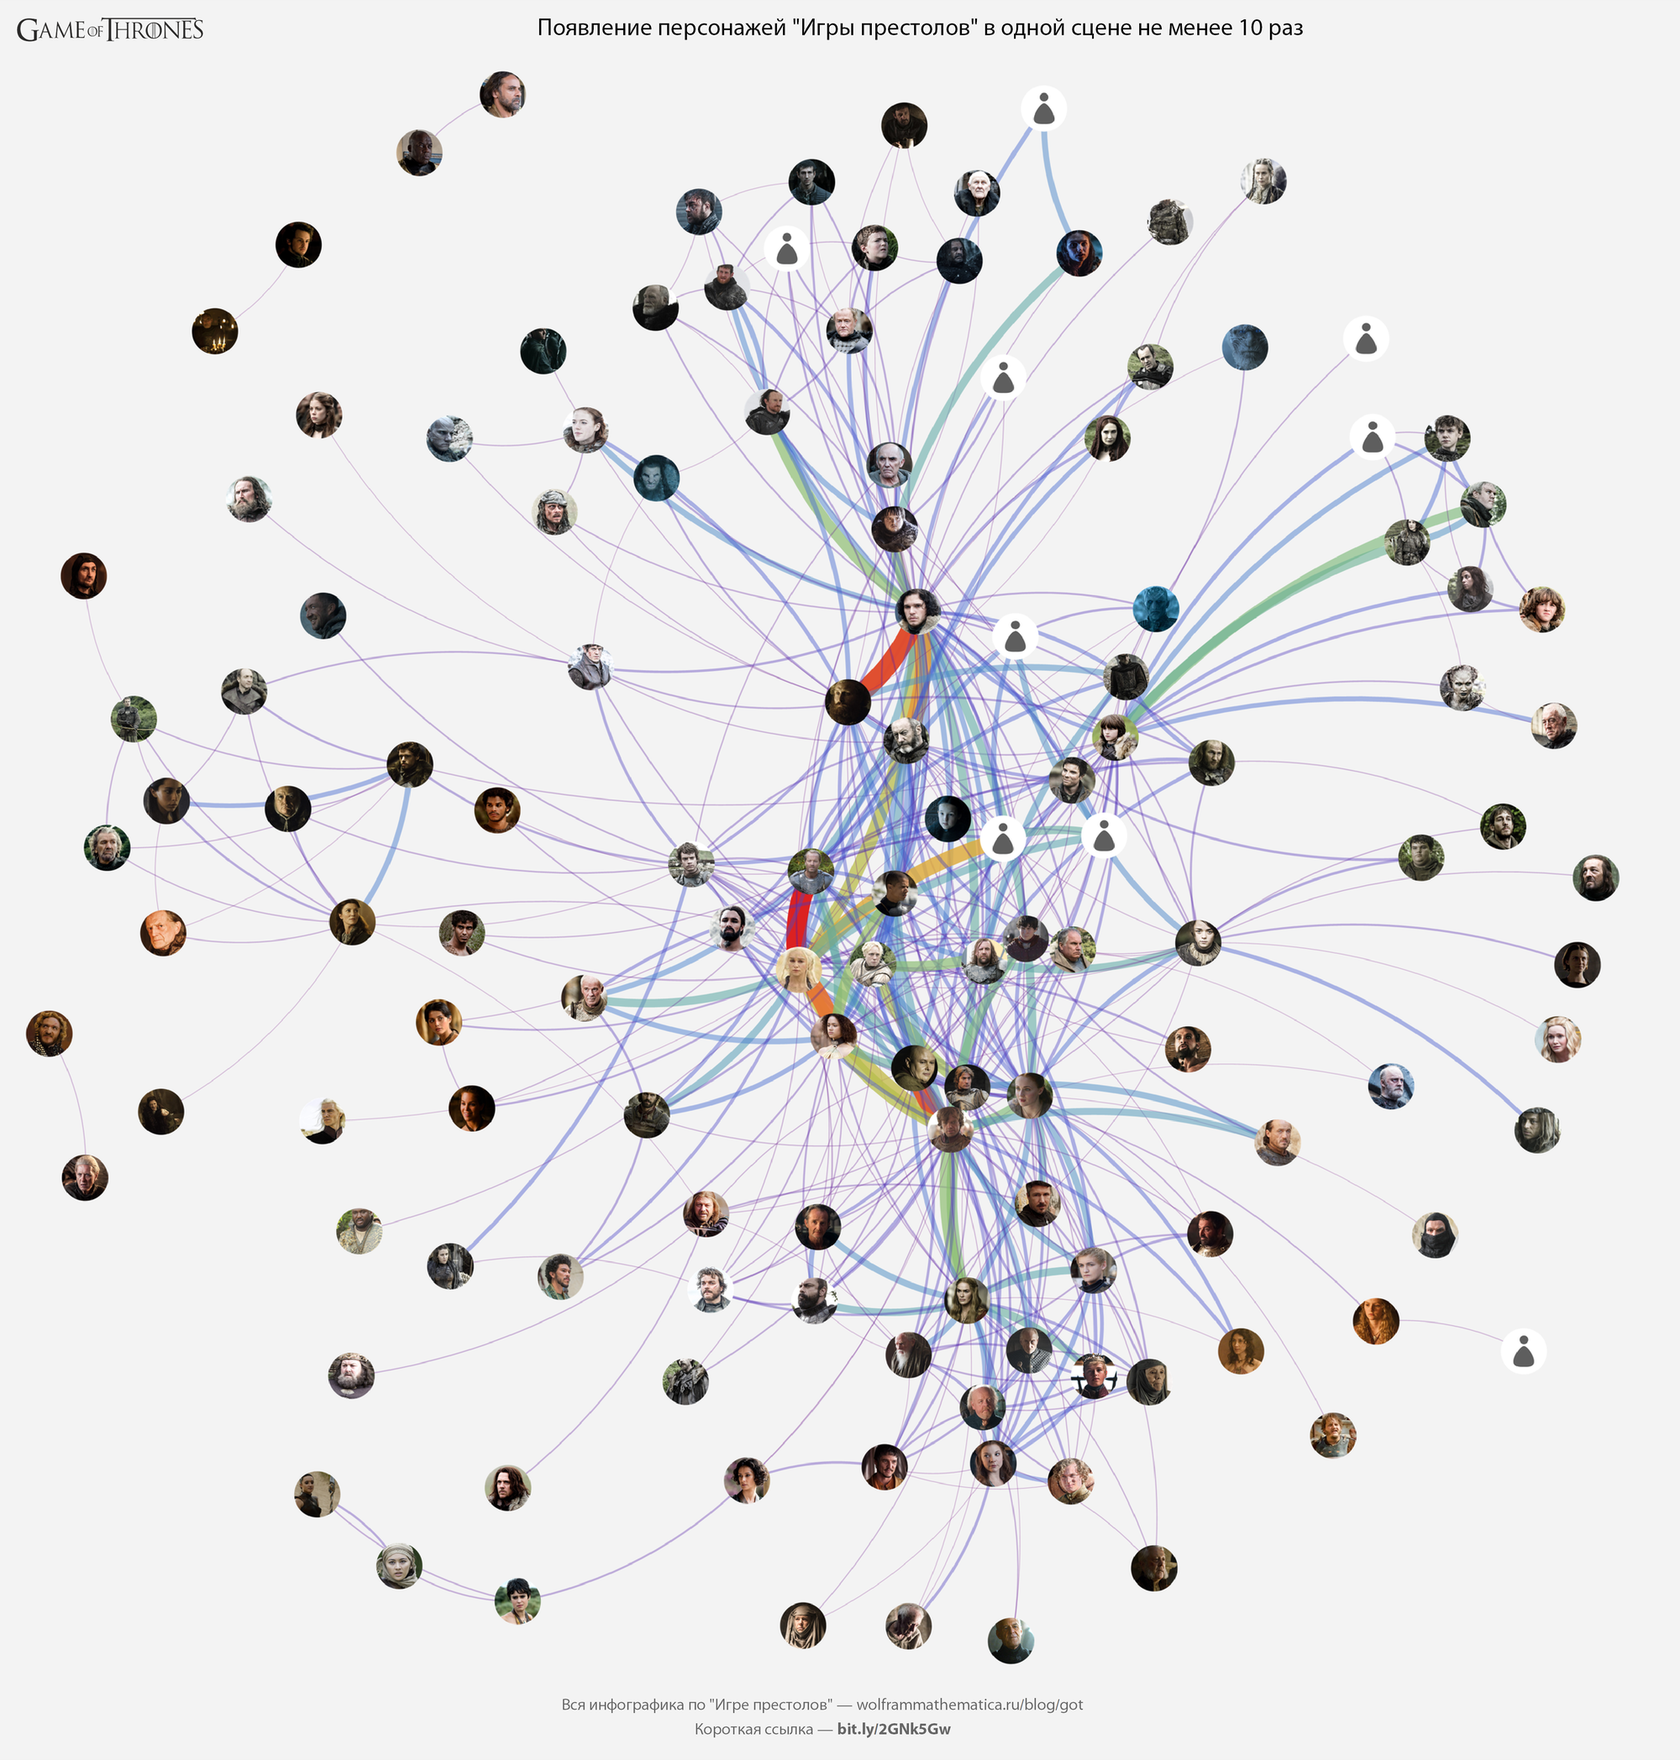
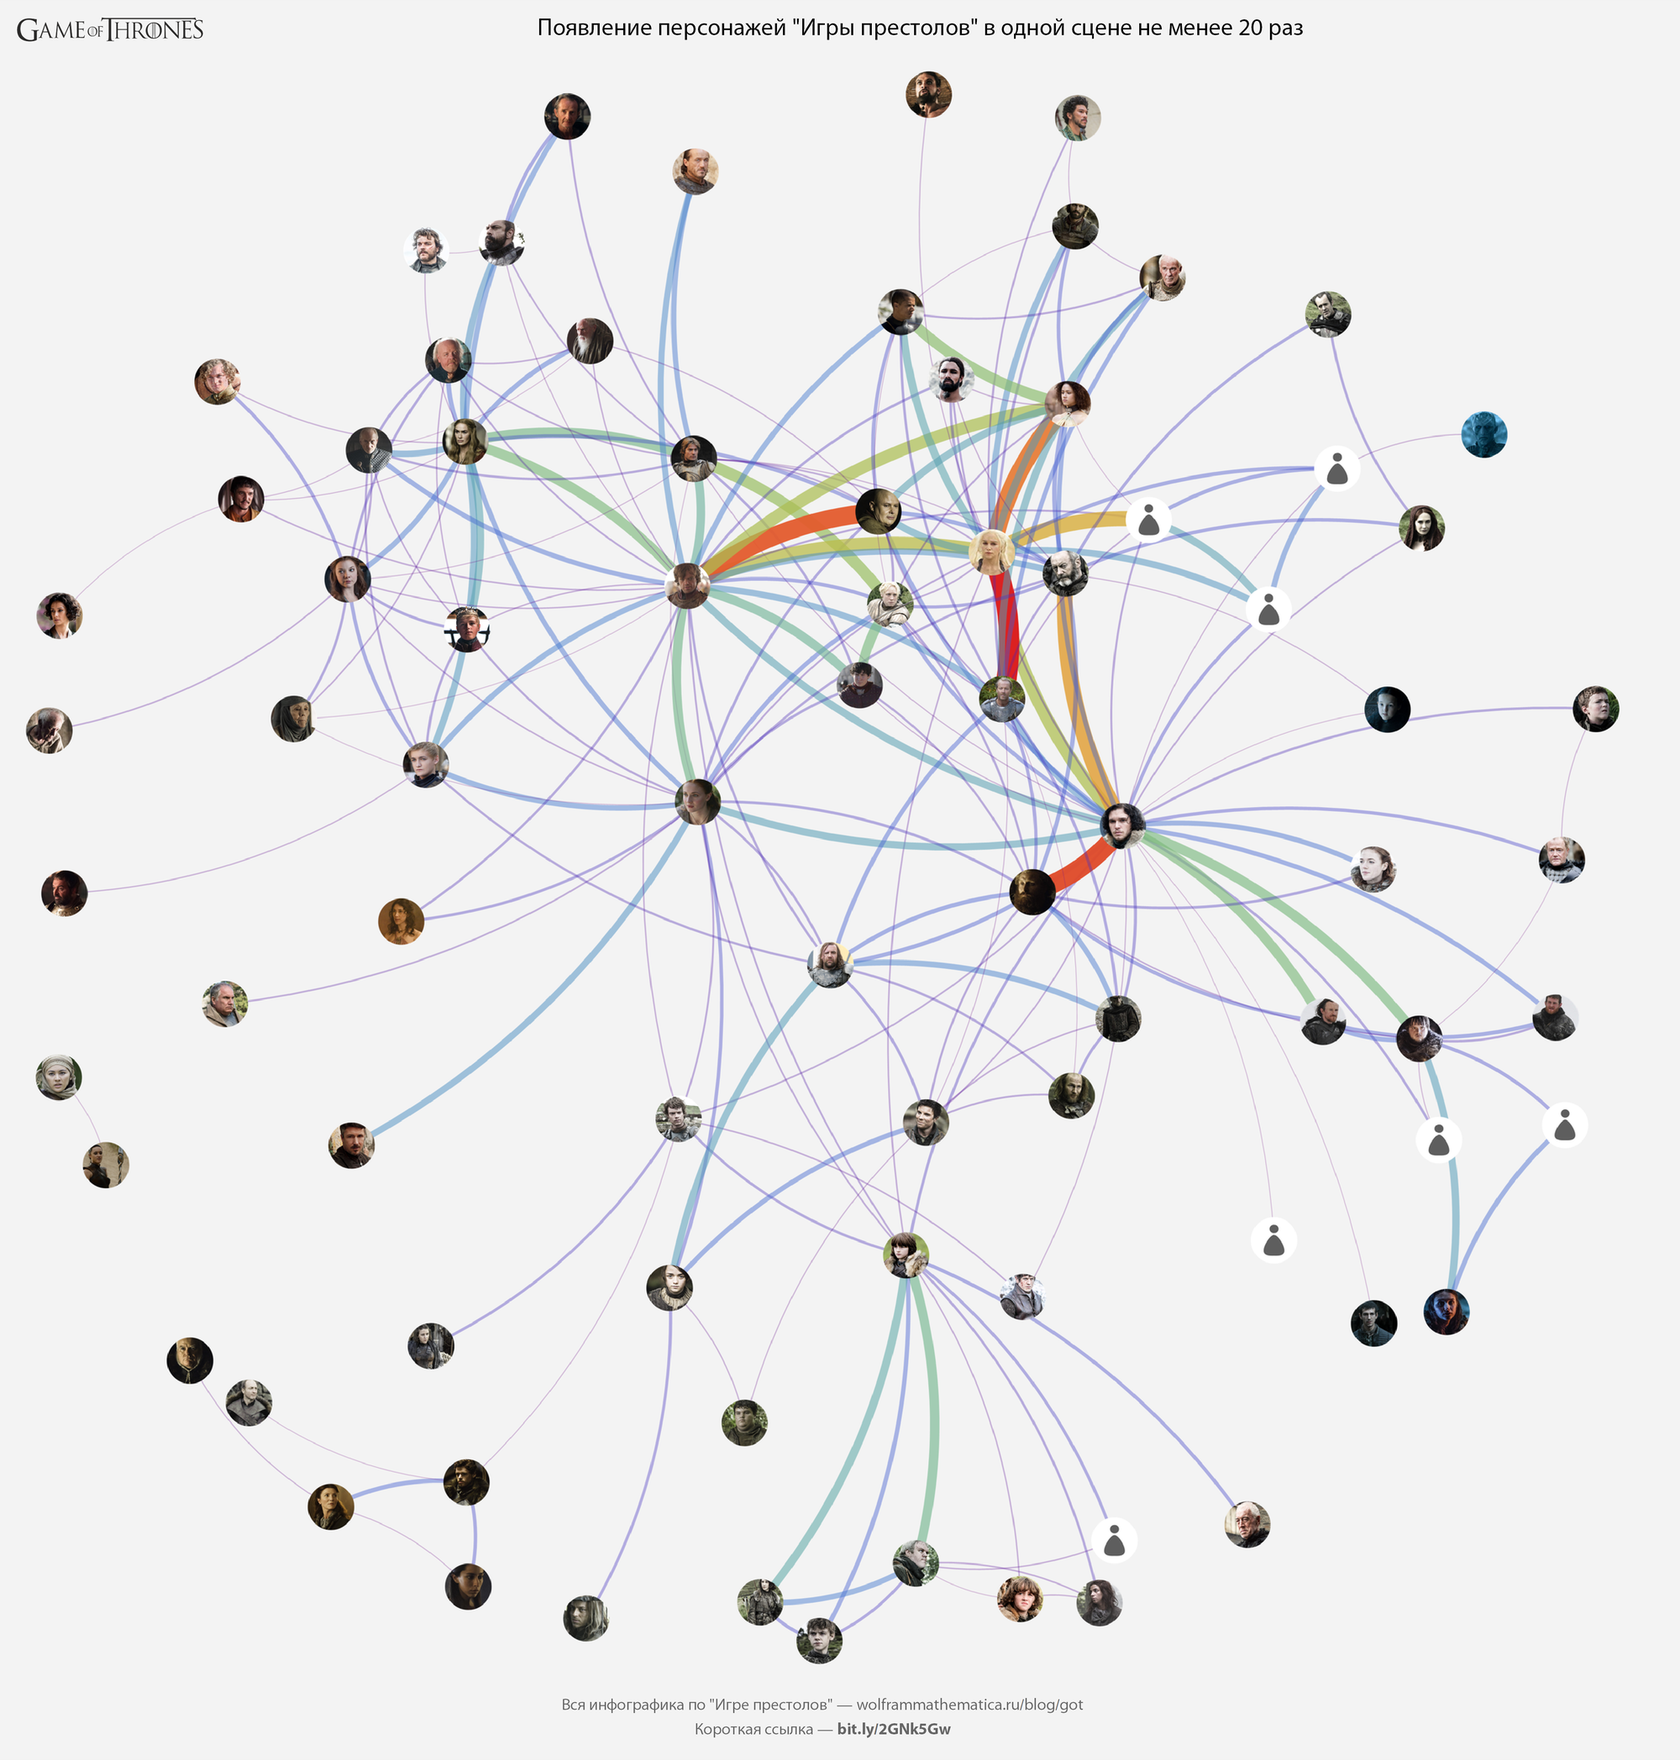
Character contact by scenes
Let's look at what characters appeared in the same scene. Each edge between the characters means that they were in the same scene. The edge is thicker and redder, the more common scenes.
Let's build several graphs: the first one shows connections, with a minimum number of scenes 2. Next – 5, 10 and 20.
Table[
    Print[
        GOTInfographicsPoster[
            GOTGraphPlot[
                #,
                min,
                "ImageSize"->Which[min==1,5000,min==4,3000,True,2000],
                "MaxThickness" -> 25
            ],
            "The appearance of characters " Game of Thrones  "in one scene no less"
            <>
            ToString[min+1]
            <>
            "one",
            "ImageSize" -> Which[min==1,5000,min==4,3000,True,2000]
        ]& @
            Tally[
                UndirectedEdge@@@
                    Map[
                        Sort,
                        Flatten[
                            Map[
                                Subsets[#,{2}]&,
                                Map[
                                    #[[;;,"name"]]&,
                                    Flatten[
                                        Lookup[
                                            GOTRawData[
                                                "episodes.json"
                                            ][
                                                "episodes"
                                            ],
                                            "scenes"
                                        ]][
                                        [;;,"characters"]
                                    ]]],
                            one
                        ]]]],
    {min, {1,4,9,19}}
];
(original)
Who is the most "popular" character of the Game of Thrones?
To answer this question, create a variable $ GOTEpisodeData in which we put a set of cleared data on the scenes for each episode of "Game of Thrones".
$ GOTEpisodeData =
    With[{data=#}[{data=#}<|
        "EpisodeN"->#[[1]],
        "ScreenTime" ->
            SorBy[
                Groupby[
                    Flatten[
                        ReplaceAll[
                            Thread / @
                                Transpose[
                                    {
                                        Map[
                                            Lookup[#[#[[1]], "name"]&,
                                            #[[2]]],
                                        Round @
                                            Map[
                                                QuantityMagnitude[
                                                    UnitConvert[
                                                        Subtract@@
                                                            (
                                                                TimeObject/@
                                                                    #[
                                                                        [
                                                                        {
                                                                            3,
                                                                            2
                                                                        }
                                                                        ]
                                                                    ]),
                                                        "Seconds"
                                                    ]]&,
                                                #[[2]]]}
                                ],
                            {Missing["KeyAbsent","name"], x_}
                            :>
                            {{"Without Characters", x}}
                        ]& @
                            data,
                        one
                    ],
                    First,
                    #[[;;,2]]&
                ],
                -Total[#]&
            ],
        "LocationTime"
        ->
        SorBy[
            GroupBy[
                Flatten[
                    ReplaceAll[
                        Thread/@
                            Transpose[
                                {
                                    Map[{#[[{4,5}]]} &,[[2]]]/.
                                    Missing["KeyAbsent","subLocation"]->
                                        Nothing
                                    Round @
                                        Map[
                                            QuantityMagnitude[
                                                UnitConvert[
                                                    Subtract@@
                                                        (
                                                            TimeObject/@
                                                                #[
                                                                    [
                                                                    {
                                                                        3,
                                                                        2
                                                                    }
                                                                    ]
                                                                ]),
                                                    "Seconds"
                                                ]]&,
                                            #[[2]]]}
                            ],
                        {Missing["KeyAbsent","name"], x_}
                        :>
                        {{"Without Characters", x}}
                    ]& @
                        data,
                    one
                ],
                First,
                #[[;;,2]]&
            ],
            -Total[#]&
        ],
        "CharacterLocations" ->
            Groupby[
                DeleteCases[
                    # /. Missing["KeyAbsent","subLocation"]-> Nothing,
                    _Missing
                ]& @
                    Flatten[
                        Map[
                            With[{location=#[{location=#[[2]]},
                                {#, location} & / @ #[[1]]]&,
                            Transpose[
                                {
                                    Map[Lookup[#[Lookup[#[[1]], "name"]&, #[[2]]],
                                    #[[2,;;,{4,5}]]}
                            ]],
                        one
                    ],
                First,
                #[[;;,2]]&
            ]|>
    ]& / @
        DeleteCases[
            Map[
                {
                    #[[{1,2}]],
                    Lookup[
                        #[[3]],
                        {
                            "characters",
                            "sceneStart",
                            "sceneEnd",
                            "location",
                            "subLocation"
                        }
                    ]} &,
                Lookup[
                    GOTRawData["episodes.json"]["episodes"],
                    {"seasonNum", "episodeNum", "scenes"}
                ]],
            {_, {_ Missing ...}}
        ];
Sample data for the first series of the first season:

The amount of screen time for characters
30 characters of "Game of Thrones" with the largest screen time:
GOTInfographicsPoster[
    #,
    "30 персонажей, которых мы видим больше всего на экране",
    "ImageSize"->1500
]& @
    circleInfographics[
        {
            Tooltip[
                Row[
                    {
                        #[[1]]/.$characterImage,
                        Style[#[#[[1]], 14, White, Bold],
                        Style[
                            UnitConvert[
                                Quantity[#[#[[2]], "Seconds"],
                                MixedUnit[
                                    {"Hours","Minutes","Seconds"}
                                ]
                            ],
                            14,
                            White
                        ]},
                    " n"
                ],
                #[[1]]/.$characterCardFull
            ],
            #[[2]]} & / @
            KeyValueMap[
                {#1,#2}&,
                SortBy[
                    Merge[
                        $GOTEpisodeData[[All,"ScreenTime"]],
                        Total[Flatten[Flatten[#]]&
                    ],
                    - # &
                ]][
                [1;;30]
            ],
        "Precision" -> 10 ^ -6,
        "StepDecrease" -> 0.99,
        "ShapeFunction" -> Disk,
        "ColorFunction" -> ColorData["Rainbow"],
        "ImageSize" -> 1500
    ]
(original)
The rest, too, will not deprive and build a large table:
GOTInfographicsPoster[
    #,
    "550+ персонажей и их экранное время",
    "ImageSize"->1500,
    "ImageResolution"->150
]& @
    Multicolumn[
        Style[
            Row[{#[{#[[1]], "[LongDash] ",[[2]], "c"}], FontFamily -> "Myriad Pro", 8
        ]& / @
            KeyValueMap[
                {#1,#2}&,
                SortBy[
                    Merge[
                        $GOTEpisodeData[[All,"ScreenTime"]],
                        Total[Flatten[Flatten[#]]&
                    ],
                    - # &
                ]],
        6
    ]
(original)
How many characters were in the series?
$ GOTEpisodeN – translates a series from format {season, the serial number of the series in the season} to just the serial number of the series throughout the series.
$ GOTEpisodeN =    <|
    Thread[
        Rule[#,Range[Length[#]]]&@$GOTEpisodeData[[All,"EpisodeN"]]
    ]|>;
$ GOTEpisodeID – operation inverse to $ GOTEpisodeN.
$ GOTEpisodeID =    <|
    Thread[
        Rule[Range[Length[#]],#]&@$GOTEpisodeData[[All,"EpisodeN"]]
    ]|>;
Construct a histogram of the number of characters involved in each of the “Game of Thrones” series
GOTInfographicsPoster[
    #,
    "Количество персонажей в сериях "Игры престолов"",
    "ImageSize"->1000
]& @
    Barchart[
        #,
        BarSpacing -> {0.05,2},
        AspectRatio-> 1/2,
        ImageSize-> 1000,
        ChartLabels -> {Keys[#]Range[10]},
        ColorFunction-> Function[{x}ColorData[{x}ColorData["Rainbow"][x]],
        GridLines -> {None, Range[0,100,5]},
        FrameLabel->
            Map[
                Style[#,FontFamily->"Open Sans",20,Bold]&,
                {
                    "Season and series in it",
                    "Number of characters involved"
                }
            ],
        Frame-> True,
        Background-> GrayLevel[0.95]
    ]& @
    Groupby[
        Map[
            {#["EpisodeN"], Length[#["ScreenTime"]]} &,
            $ GOTEpisodeData[[All,{"EpisodeN","ScreenTime"}]]],
        #[[1,1]]&,
        #[[;;,2]]&
    ]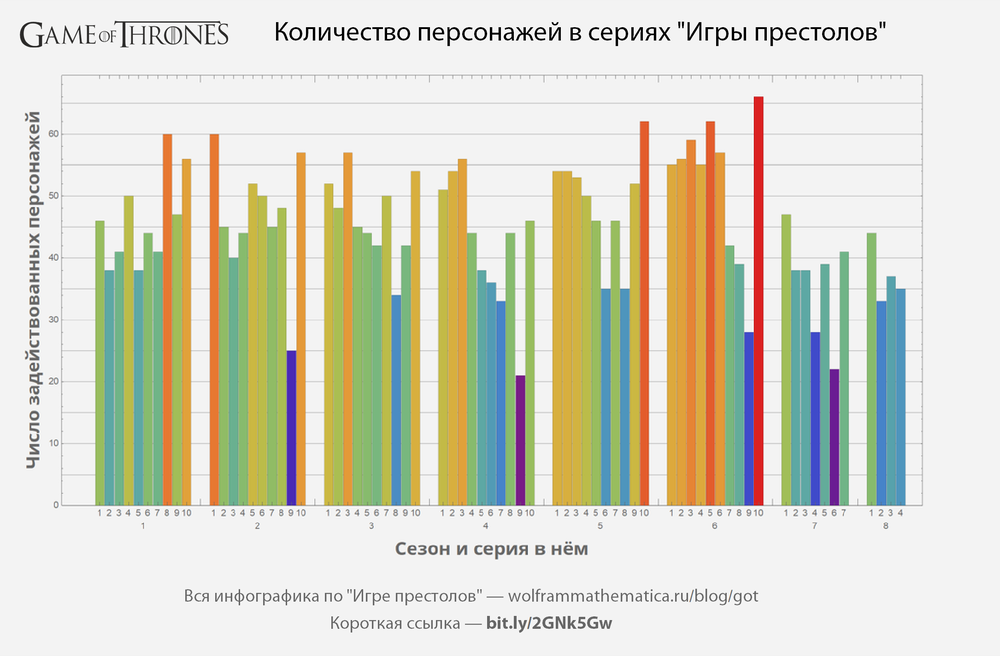
Which of the characters was the largest number of the Game of Thrones series?
The list of characters in "Game of Thrones", sorted by the number of series in which they met:
$ GOTCharacters =
    DeleteCases[
        Reverse[
            SortBy[
                Tally[
                    Flatten[Keys@$GOTEpisodeData[[All,"ScreenTime"]]]],
                Last
            ]][
            [;;,1]
        ],
        "Without Characters"
    ];
Number of episodes per season:
$ GOTSeriesInSeason =    <|
    KeyValueMap[#1->Length @ # 2 &, GroupBy[$GOTEpisodeData[$GOTEpisodeData[[;;,1]], First]]|>;
“Mask” of the season (service symbol):
$ GOTSeasonsMask = KeyValueMap[ConstantArray[#1,#2]&, $ GOTSeriesInSeason];
GOTCharacterBySeason calculates in which series of what seasons the character "Game of thrones" was involved:
GOTCharacterBySeason[name_]: =
    Module[{initialData, empty},
        initialData =
            Map[
                #[[;;,2]]&,
                Groupby[
                    Cases[
                        {#[[1]]Keys[#[#[[2]]]} & / @
                            Lookup[
                                $GOTEpisodeData,
                                {"EpisodeN","ScreenTime"}
                            ],
                        {number_, episode _ /; Not[FreeQ[episode,name]]}:>
                            number
                    ],
                    First
                ]];
        empty = complement[Range[1,8]Keys[initialData]];
        If[
            Length[empty]=== 0,
            initialData,
            (* else *)
            KeySort @ <| initialData,<|#->{} & / @ empty |> |>
        ]]
GOTCharacterBySeasonPlot visualizes the data received GOTCharacterBySeason.
GOTCharacterBySeasonPlot[name_]: =
    Flatten @
        KeyValueMap[
            ReplacePart[
                $GOTSeasonsMask[[#1]],
                Thread[
                    Complement[Range[1,$GOTSeriesInSeason[#1]]# 2]-> 0
                ]]&,
            GOTCharacterBySeason[name]
        ]
$ GOTSeasonColors a set of colors in order to visually display a set of series of the season.
$ GOTSeasonColors =
{0-> White}
~
Join
~
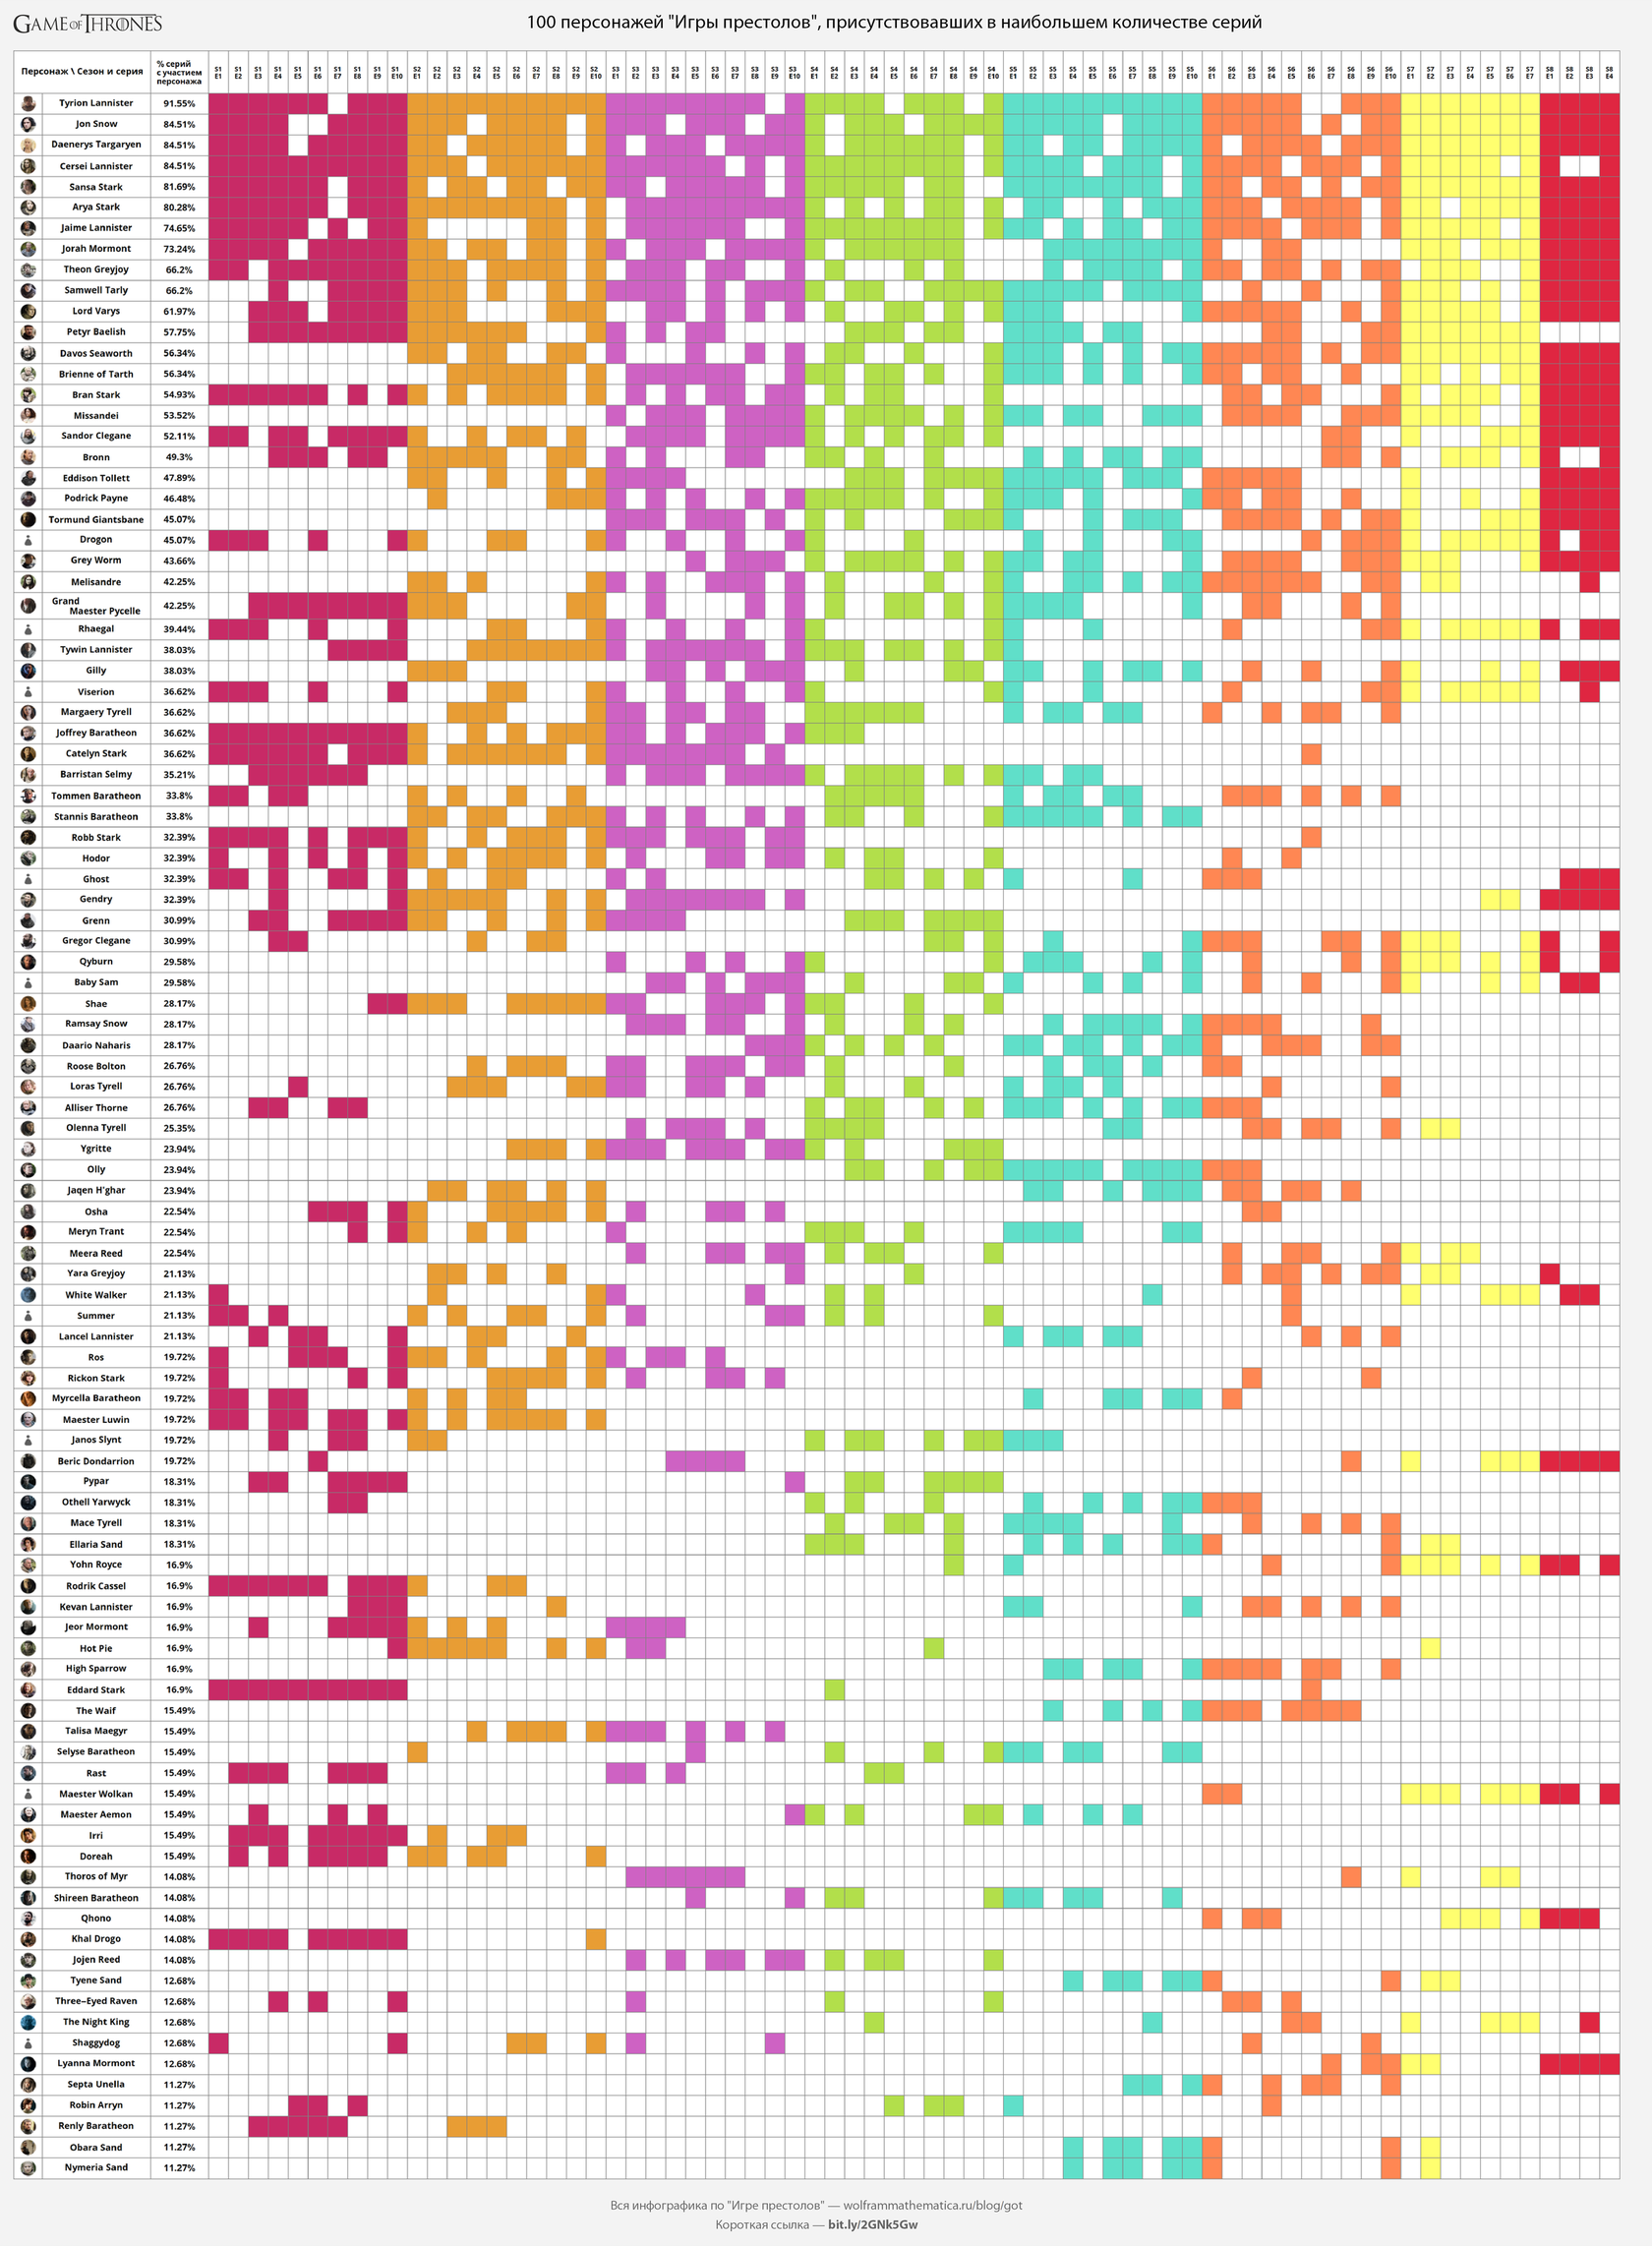
Thread[Range[1,8]-> ColorData[54,"ColorList"][[1;;8]]];Finally, we will build a table in which you can clearly see which of the characters in which series of “Game of Thrones” was, and which was not)
GOTInfographicsPoster[
    #,
    "100 персонажей "Игры престолов", присутствовавших в наибольшем количестве серий",
    "ImageSize"->2500
]& @
    Grid[
        {
            {
                "Персонаж \ Сезон и серия",
                SpanFromLeft,
                Style["% серийnс участиемnперсонажа",12]
            }
            ~
            Join
            ~
            Map[
                Style[
                    "S" <> ToString[#[#[[1]]]<> " nE" <> ToString[#[#[[2]]],ten
                ]&,
                Keys[$GOTEpisodeN]
            ]}
        ~
        Join
        ~
        (
            (
                {
                    ImageResize[#/.$characterImage,{Automatic,25}],
                    #,
                    Percentform[
                        N @ Total[Length/@GOTCharacterBySeason[Length/@GOTCharacterBySeason[#]]/
                        Last[$GOTEpisodeN]
                    ]}
                ~
                Join
                ~
                ReplaceAll[
                    GOTCharacterBySeasonPlot[#],
                    x_Integer:> Item["",Background->x/.$GOTSeasonColors]
                ]& / @
                    DeleteCases[
                        $GOTCharacters[[1;;100]], "Without Characters"
                    ])
        ),
        ItemSize -> {{2,10,5, {1.2}}, {4, {1}}},
        Background-> White,
        Dividers-> Gray,
        ItemStyle
        ->
        Directive[
            FontFamily->"Open Sans",14,Bold,LineSpacing->{0.8,0,0}
        ],
        Alignment -> {Center, Center}
    ]
(original)
The most popular “Game of Thrones” locations
Location Map "Game of Thrones"
Construct a map of geometric primitives. Create a set of them:
index = 1;
$ GOTLakesIDs =
    {
        eleven,
        eight,
        9,
        ten,
        2,
        529,
        530,
        522,
        523,
        533,
        532,
        526,
        521,
        525,
        531,
        524,
        528,
        527,
        7,
        3,
        four,
        five,
        6
    };
$ GOTMapPolygons =
    {
        FaceForm @ If[MemberQ[$GOTLakesIDs,index], LightBlue, LightOrange],
        EdgeForm[AbsoluteThickness[1]],
        index ++; Polygon[Accumulate[Accumulate[#]]} & / @
        GOTRawData["lands-of-ice-and-fire.json"]["arcs"];
Create a set of places on the Game of Thrones map
$ GOTMapPlaces =
    Lookup[
        GOTRawData["lands-of-ice-and-fire.json"]["objects"]["places"][
            "geometries"
        ],
        {"coordinates", "properties"}
    ];
$ GOTMapPlaceCoordinates = Map[#[[2,"name"]]-> #[[1]]&, $ GOTMapPlaces];
Function GOTMap serves to build all sorts of "geographical" places and trajectories on the "Game of Thrones" map:
GOTMap[additinals_,OptionsPattern[{"ImageSize"->1500}]]: =
    Legended[
        Graphics[
            {
                $ GOTMapPolygons,
                (
                    {
                        {
                            AbsolutePointSize[10],
                            Black,
                            Point[#one[#1[[1]]],
                            AbsolutePointSize[5],
                            White,
                            Point[#one[#1[[1]]]},
                        Inset[
                            With[{placeType=#1[{placeType=#1[[2]]["type"]},
                                (
                                    Framed[
                                        #1,
                                        Background
                                        ->
                                        (
                                            placeType
                                            /.
                                            Thread[
                                                {
                                                    "city",
                                                    "castle",
                                                    "ruin",
                                                    "town"
                                                }
                                                ->
                                                (
                                                    Lighter[
                                                        RGBColor[
                                                            #1/255
                                                        ],
                                                        0.5
                                                    ]&
                                                ) / @
                                                    {
                                                        {254.92,7},
                                                        {254,252,9},
                                                        {138,182,7},
                                                        {2,130,237}
                                                    }
                                            ]),
                                        RoundingRadius-> 6,
                                        FrameStyle-> None,
                                        FrameMargins-> 2
                                    ]&
                                )[
                                    Style[
                                        #one[[2]]["name"],
                                        LineSpacing -> {0.8,0,0},
                                        FontFamily -> "Open Sans",
                                        Bold
                                        12
                                    ]]],
                            #one[[1]],
                            If[
                                MemberQ[
                                    {
                                        "Eastwatch",
                                        "The Dreadfort",
                                        "White Harbor",
                                        "Storm's End",
                                        "Ghoyan Drohe",
                                        "Qohor"
                                    },
                                    #one[[2]]["name"]
                                ],
                                Scaled[{-0.1,1/2}],
                                (* else *)
                                Scaled[{1.1,1/2}]
                            ]]} &
                ) / @
                    $ GOTMapPlaces,
                additinals
            },
            ImageSize-> OptionValue["ImageSize"],
            Background-> LightBlue,
            PlotRangePadding-> 0
        ],
        (Placed[#1,"Bottom"]&)[
            SwatchLegend[
                (RGBColor[#1/255]&) / @
                    {{254.92,7}, {254,252,9}, {138,182,7}, {2,130,237}},
                {"city", "castle", "ruin", "town"},
                LegendLayout -> "Row"
            ]]]
Build the map itself:
GOTInfographicsPoster[
    #,"Карта расположения локаций "Игры престолов"","ImageSize"->1500
]& @
    GOTMap[{}]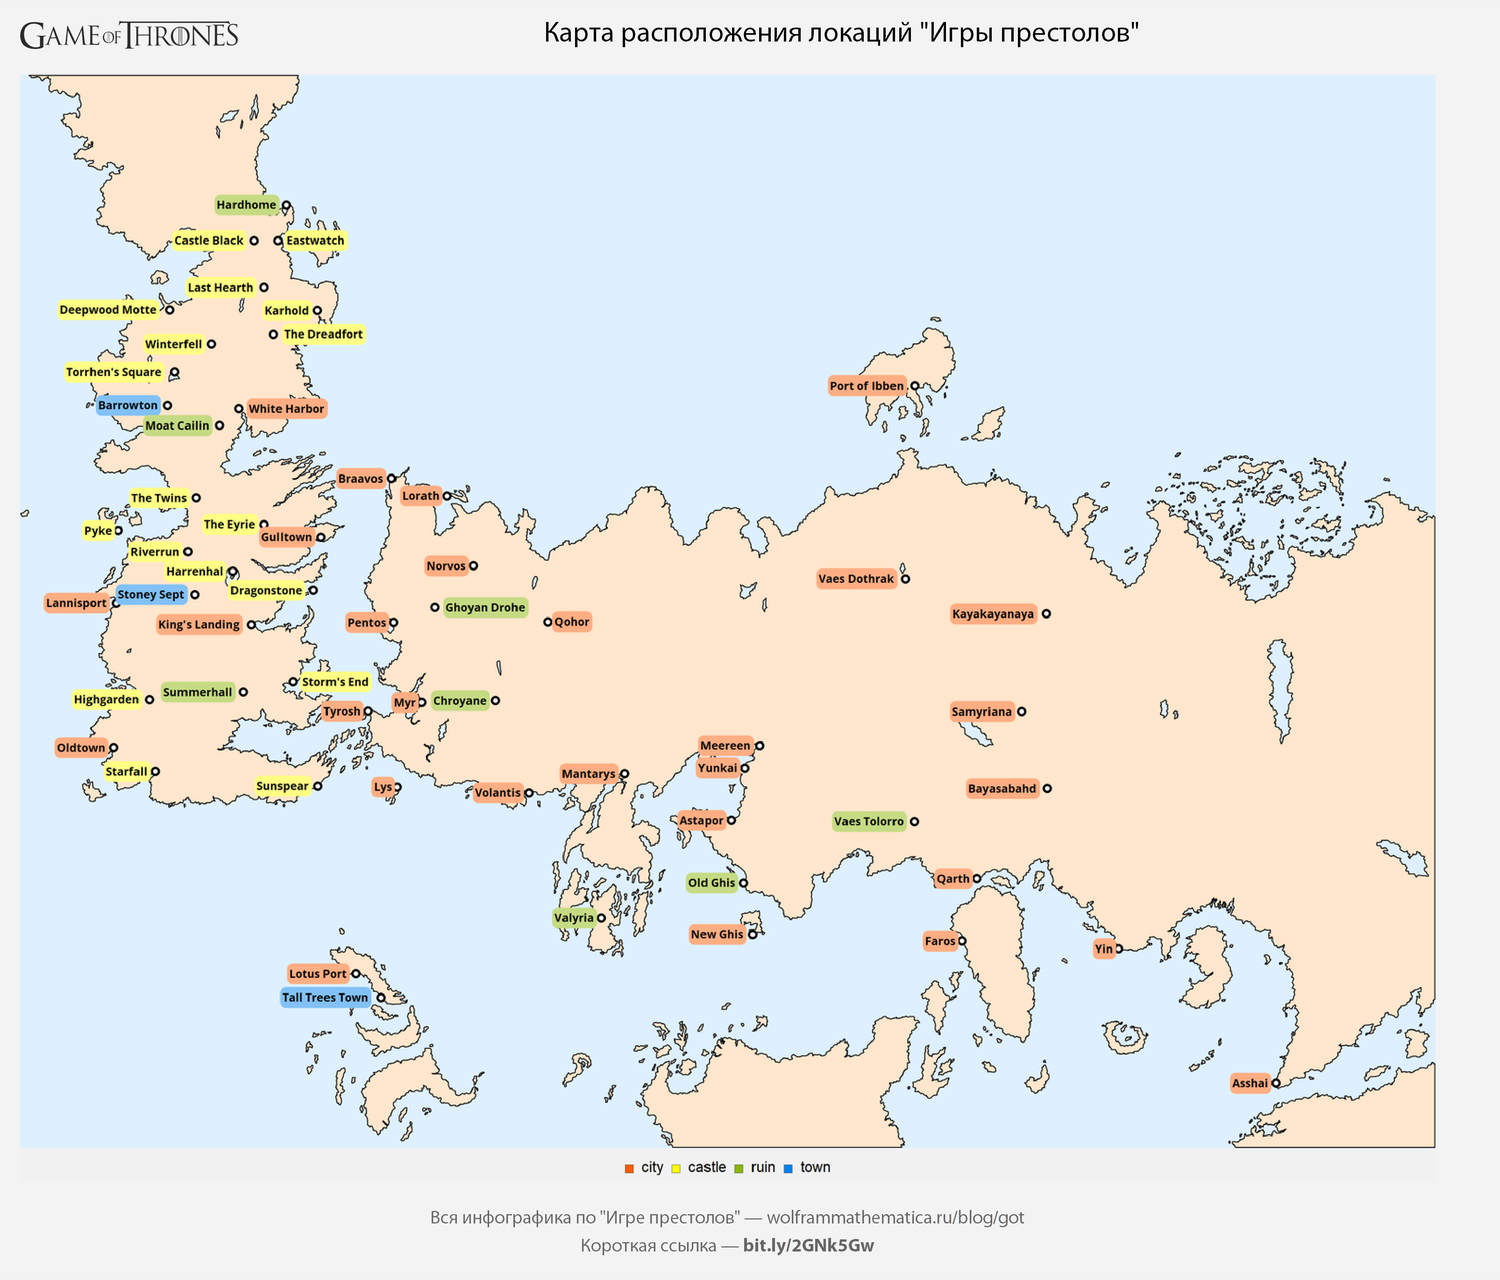
Moving the characters "Game of Thrones" from series to series
Function GOTCharacterLocationNamesSequence calculates the character's movement between the “Game of Thrones” locations:
GOTCharacterLocationNamesSequence[name_]: =
    Merge[$GOTEpisodeData[[;;,"CharacterLocations"]]Identity][name];
Function GOTCharacterLocationSequence translates place names into their “geographic” coordinates:
GOTCharacterLocationSequence[name_]: =
    DeleteCases[
        Partition[
            Flatten[
                DeleteCases[
                    GOTCharacterLocationNamesSequence[name]
                    /.
                    {{x_String, y_String}:> y, {x_String}:> x}
                    /.
                    $ GOTMapPlaceCoordinates,
                    _String,
                    Infinity
                ],
                one
            ],
            2,
            one
        ],
        {x_, x_}
    ];
Function GOTMapTraectory builds a trajectory on the Games of Thrones map:
ClearAll[GOTMapTraectory];
GOTMapTraectory[path_colorFunction_:ColorData[path_colorFunction_:ColorData["Rainbow"]]: =
    Module[{kol},
        kol=Length[path];
        Table[
            {
                Opacity[0.5],
                colorFunction[(i-1)/(kol-1)],
                AbsoluteThickness[10i/kol+1],
                Capform["Round"],
                Arrow[
                    BSplineCurve[
                        {
                            path[[i,1]],
                            Mean[path[[i]]]+
                            Randominteger[{5000,20000}]
                            Function[#/Norm[#/Norm[#]][
                                RandomChoice[{1,1}]
                                {-1,1}
                                *
                                Reverse[path[[i,2]]-path[[i,1]]]],
                            path[[i,2]]}
                    ]]},
            {i, 1, kol}
        ]];
Finally, we can build a map of the movement of any character of the “Game of Thrones”. Build them for the 10 most popular characters.
(
    Print[
        With[{track=#1name=#1[{track=#1name=#1[[1]]},
            (
                GOTInfographicsPoster[
                    #1,
                    Row[
                        {
                            "Перемещения ",
                            Style[name,Bold],
                            "in " Game of Thrones  "",
                            " n",
                            Style[
                                "(линия перемещения утолщается от начала к концу)",
                                25
                            ]
                        }
                    ],
                    "ImageSize" -> 1500
                ]&
            )[
                GOTMap[
                    {
                        Arrowheads[{0,0.01}],
                        (
                            With[{color=#1[{color=#1[[2]]},
                                GOTMapTraectory[
                                    GOTCharacterLocationSequence[name]
                                ]]&
                        )[
                            track
                        ],
                        Inset[
                            track[[1]]/.$characterCardFull,
                            Scaled[{0.99,0.99}],
                            Scaled[{1,1}]
                        ]}
                ]]]]&
) / @
    ({# 1, RGBColor[{200,42,102}/255]} &) / @ $ GOTCharacters[[1;;10]];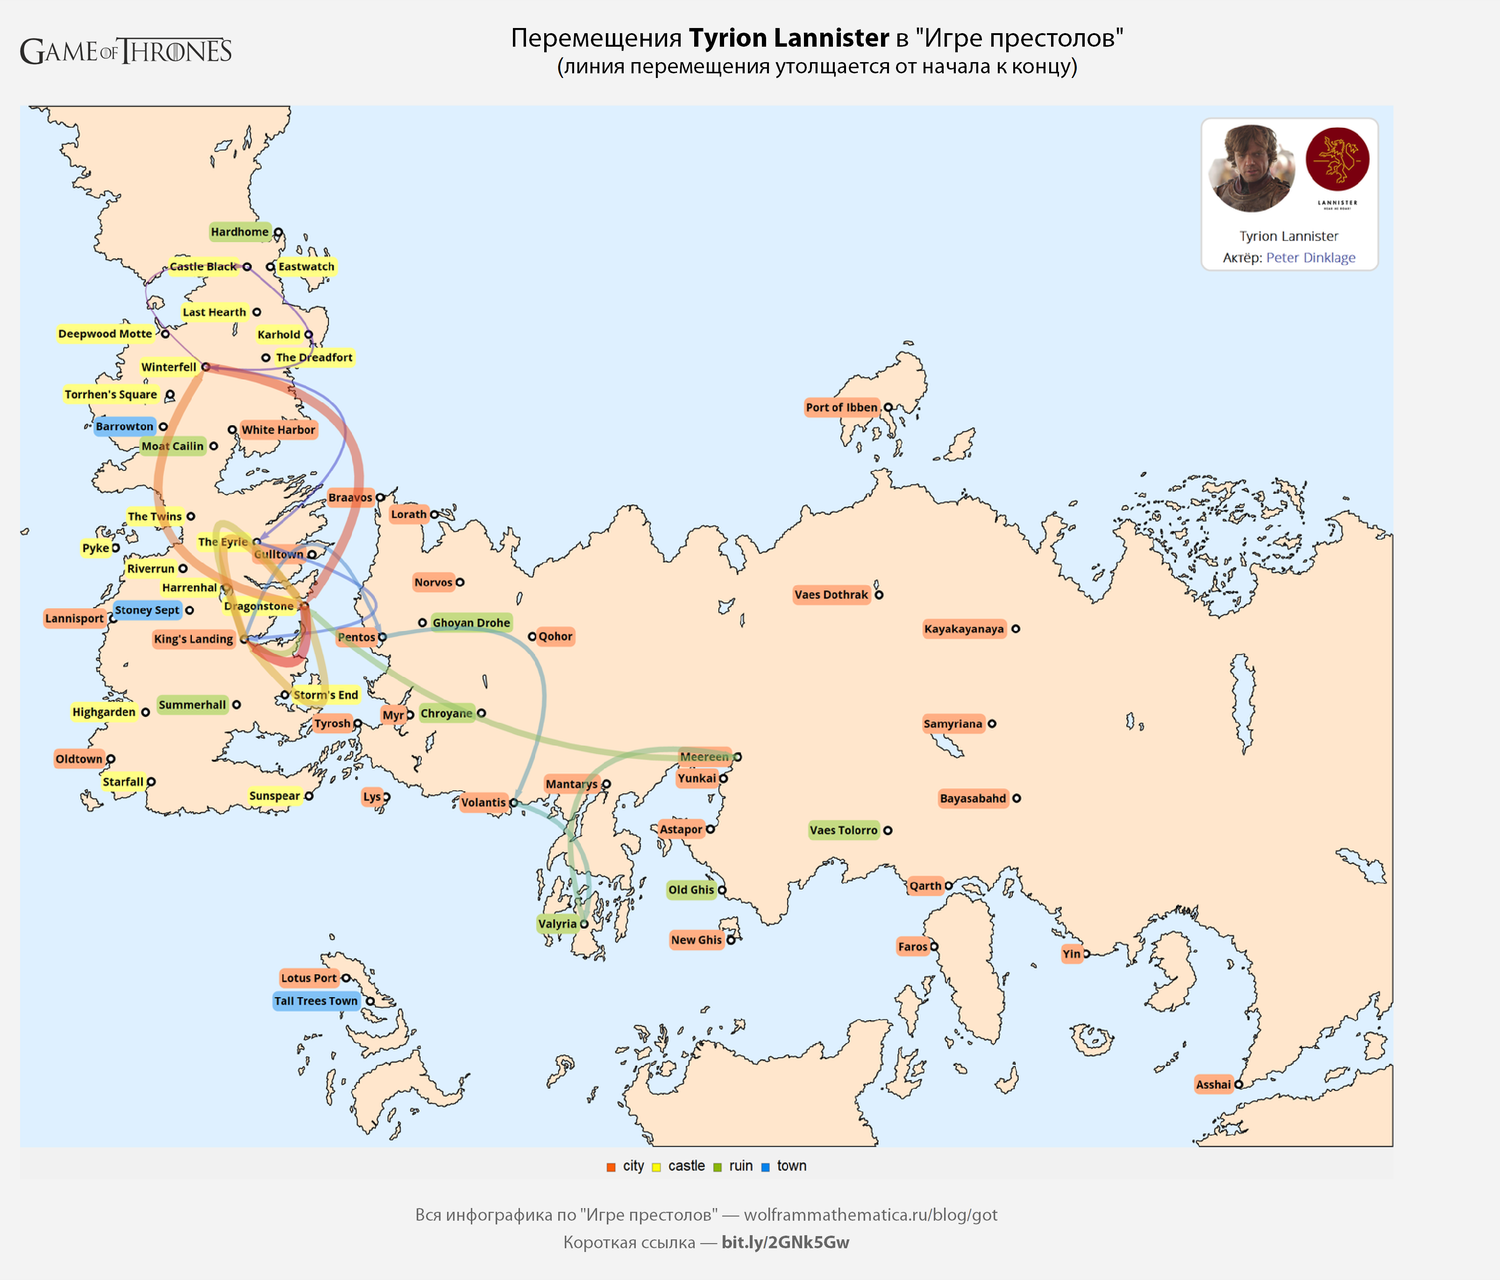

(other cards see here)
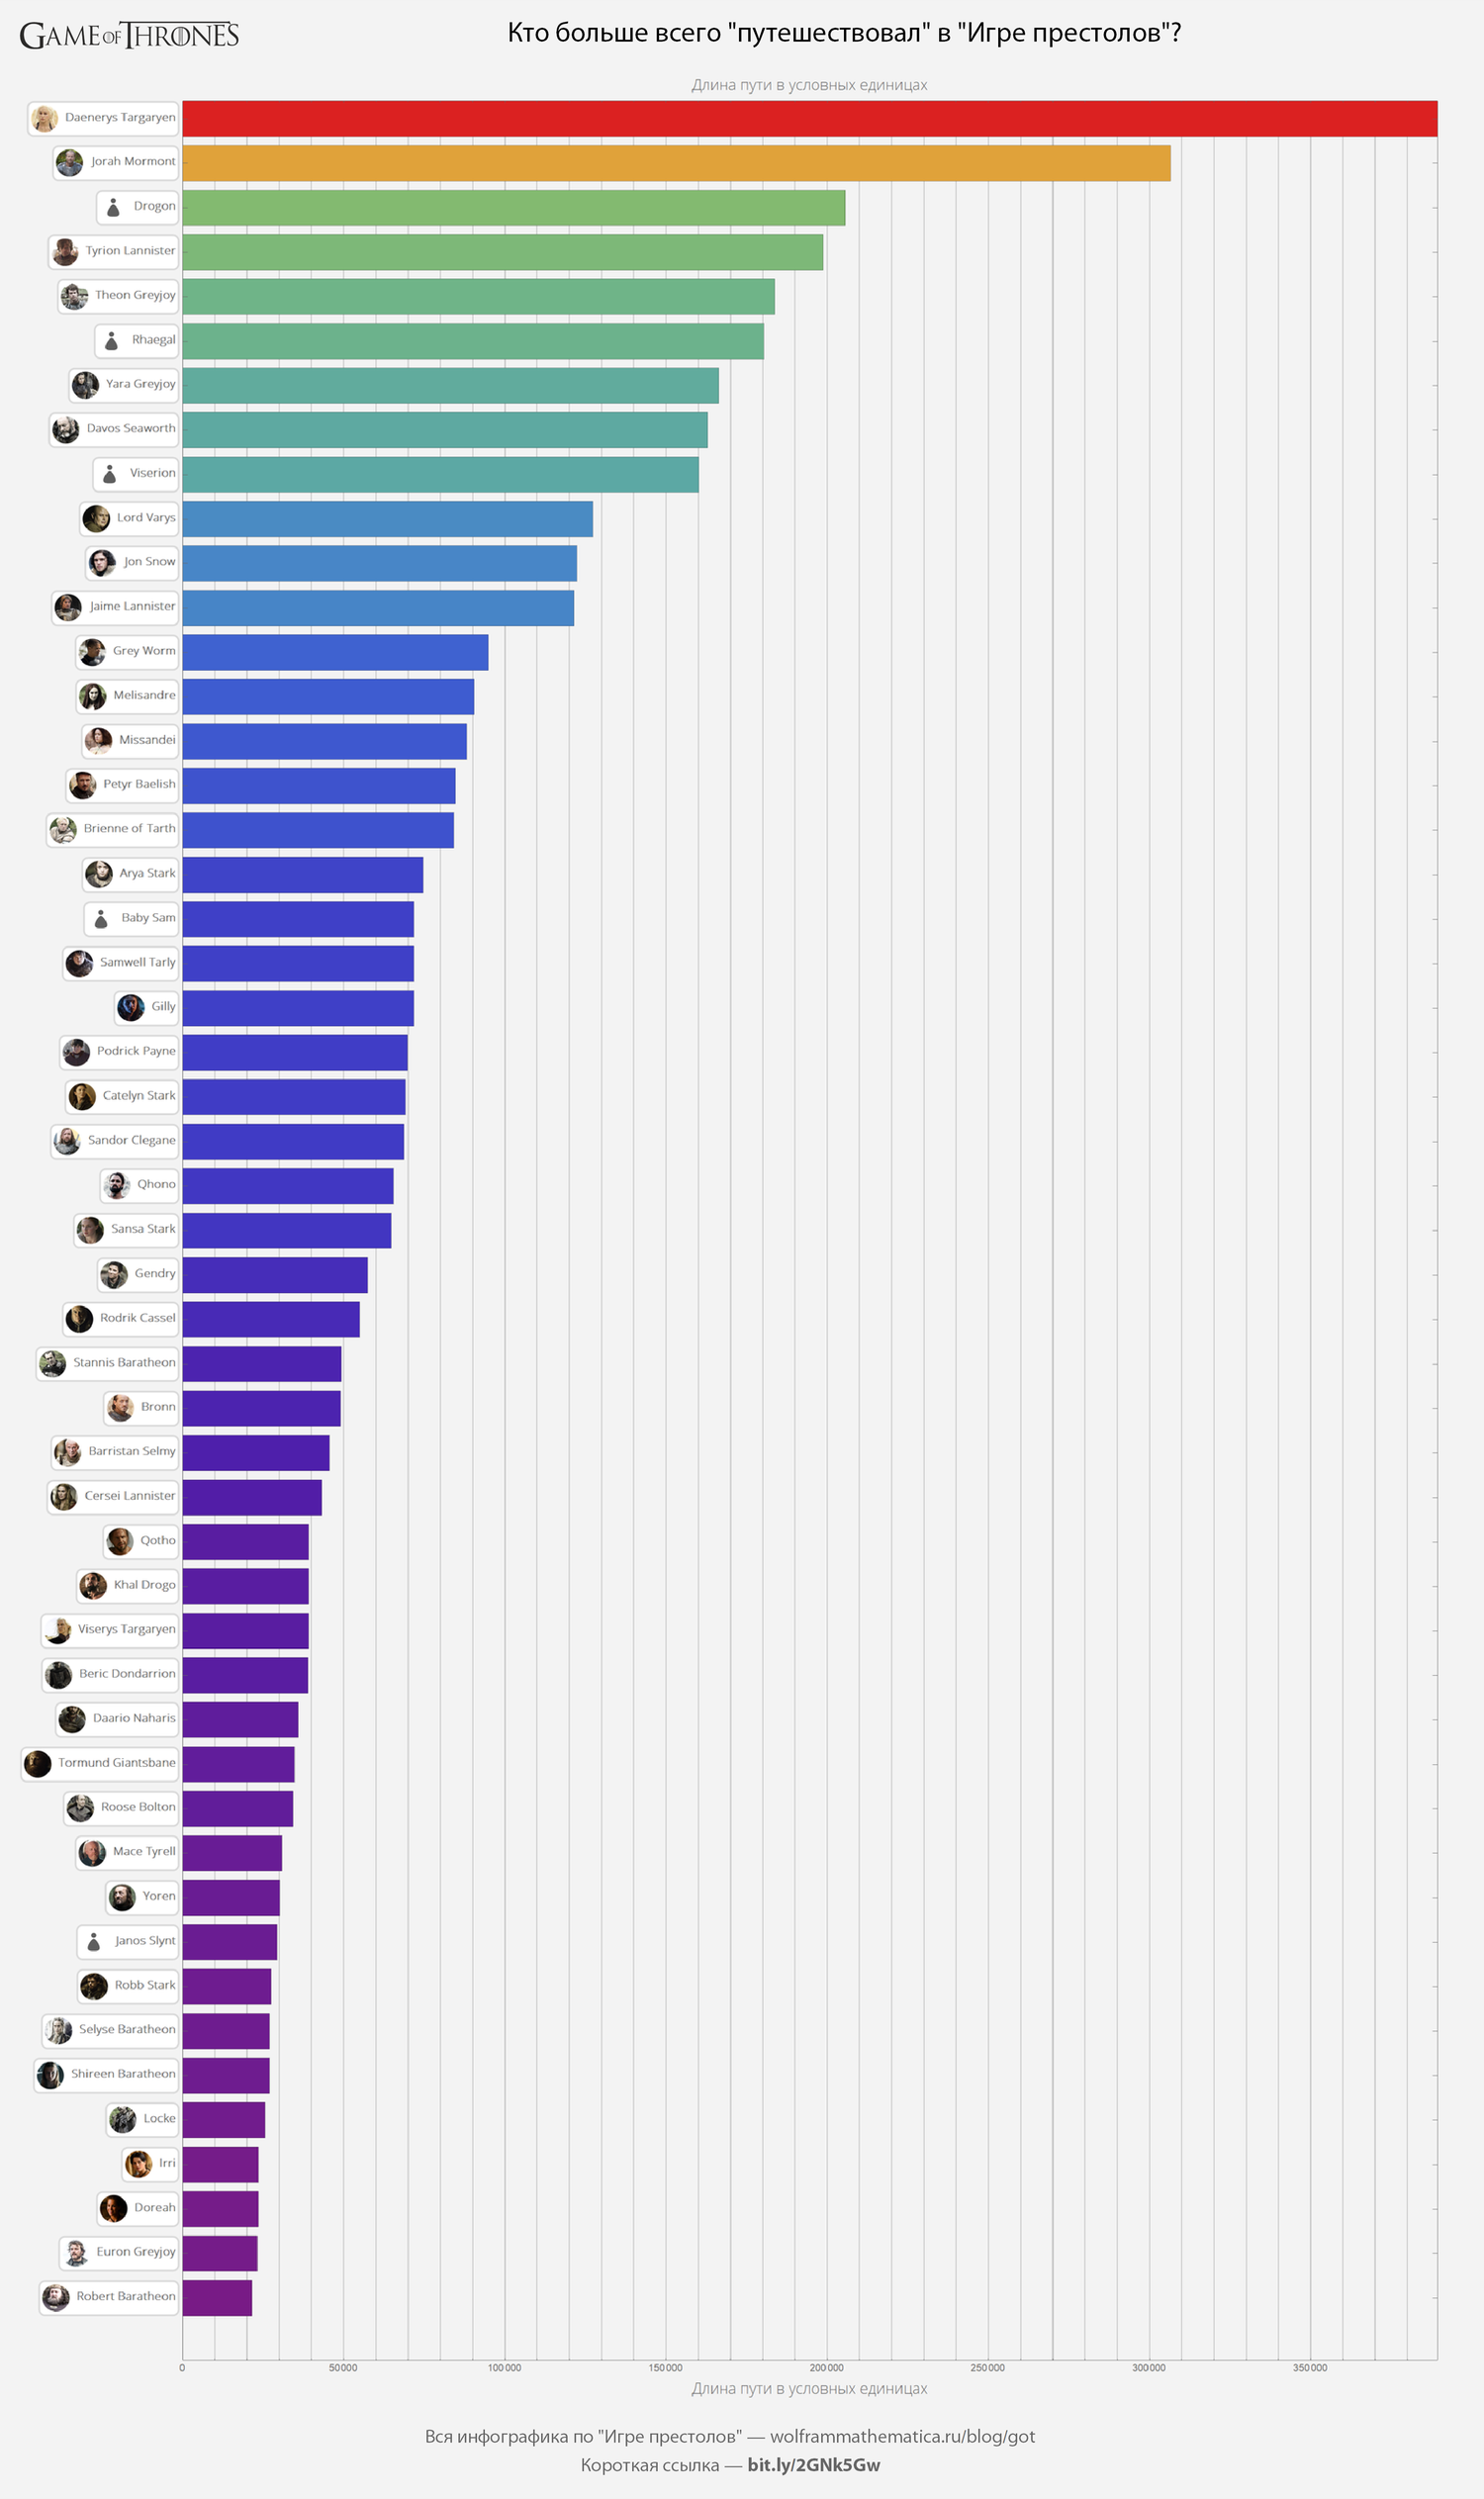
Who is the most "traveled" of the characters "Game of Thrones"?
Let us find the length of the path traversed by each character of the “Game of Thrones” in arbitrary units and see who most of all beat Vesteros:
GOTInfographicsPoster[
    #1,
    "Кто больше всего "путешествовал" в "Игре престолов"?",
    "ImageSize"->1500
]& @
    (
        (
            Barchart[
                #1[[1;;All,1]],
                PlotRangePadding-> 0,
                BarSpacing-> 0.25,
                BarOrigin-> Left,
                AspectRatio-> 1.8,
                ImageSize-> 1500,
                ChartLabels -> # 1[[1;;All,2]],
                Frame-> True,
                GridLines -> {Range[0,10^6,10^4], None},
                ColorFunction-> ColorData["Rainbow"],
                FrameLabel->
                    {
                        {None, None},
                        Style[#,FontFamily->"Open Sans Light",16]& / @
                            {
                                "Path length in arbitrary units",
                                "Path length in arbitrary units"
                            }
                    },
                Background-> GrayLevel[0.95]
            ]&
        )[
            Cases[
                SortBy[
                    (
                        {
                            Total[
                                (Norm[Subtract@@#1]&) / @
                                    GOTCharacterLocationSequence[#1]
                            ],
                            # 1 /.$ characterCardShortSmall
                        } &
                    ) / @
                        DeleteCases[
                            $GOTCharacters,
                            Alternatives@@
                                {
                                    "БезПерсонажей",
                                    "Musician #1",
                                    "Musician #2",
                                    "Musician #3"
                                }
                        ],
                    First[#1]&
                ],
                {x _ /; x> 0, _}
            ][
                [-50;;-1]
            ]])
The most popular "Game of Thrones" locations (in screen time)
For each location (and region) on the Games of Thrones map, we calculate the total screen time and display the result in several forms. The most popular locations will be immediately visible.
Data in the form of a bar graph:
GOTInfographicsPoster[
    #1,
    "Локации "Игры престолов" по экранному времени (вид 1)",
    "ImageSize"->2000
]& @
    (
        Barchart[
            #[[;;,1]],
            PlotRangePadding-> 0,
            BarSpacing -> {0.5,3},
            BarOrigin-> Left,
            AspectRatio-> 1.5,
            ImageSize-> 2000,
            ChartLabels -> {#[[;;,2]], None},
            ColorFunction->
                Function[
                    {x}, If[x>4000RedColorData[x>4000RedColorData["Rainbow"][x/4000]]],
            ColorFunctionScaling-> False,
            PlotRange -> {0.55000},
            Frame-> True,
            GridLines -> {Range[0,60000,1000], None},
            GridLinesStyle-> LightGray,
            FrameTicks -> {All, Automatic},
            FrameLabel->
                {
                    {None, None},
                    Style[#,FontFamily->"Open Sans Light",16]& / @
                        {
                            "Screen time, seconds",
                            "Screen time, seconds"
                        }
                },
            Background-> GrayLevel[0.95]
        ]& @
            KeyValueMap[
                {
                    Callout[
                        #[[1]],
                        #[[2]],
                        If[#[#[[1]]> 20,000, Bottom, Right],
                        If[#[#[[1]]> 4000, Scaled[1/2], Automatic]]& / @
                        Transpose[{#2[{#2[[;;,2]]# 2[[;;,1]]}],
                    #one
                } &,
                Sortby[
                    GroupBy[
                        KeyValueMap[
                            {#1,#2}&,
                            Merge[
                                $GOTEpisodeData[[All,"LocationTime"]],
                                Total[Flatten[Flatten[#]]&
                            ]],
                        #[[1,1]]&,
                        Sortby[
                            Transpose[
                                {
                                    #[[;;,1]]/.
                                    {
                                        {x_String, y_String}:> y,
                                        {x_String}:> x
                                    },
                                    #[[;;,2]]}
                            ]/.
                            {"", _}:> Nothing,
                            Last[#]&
                        ]&
                    ],
                    Total[#[#[[;;,2]]]&
                ]])
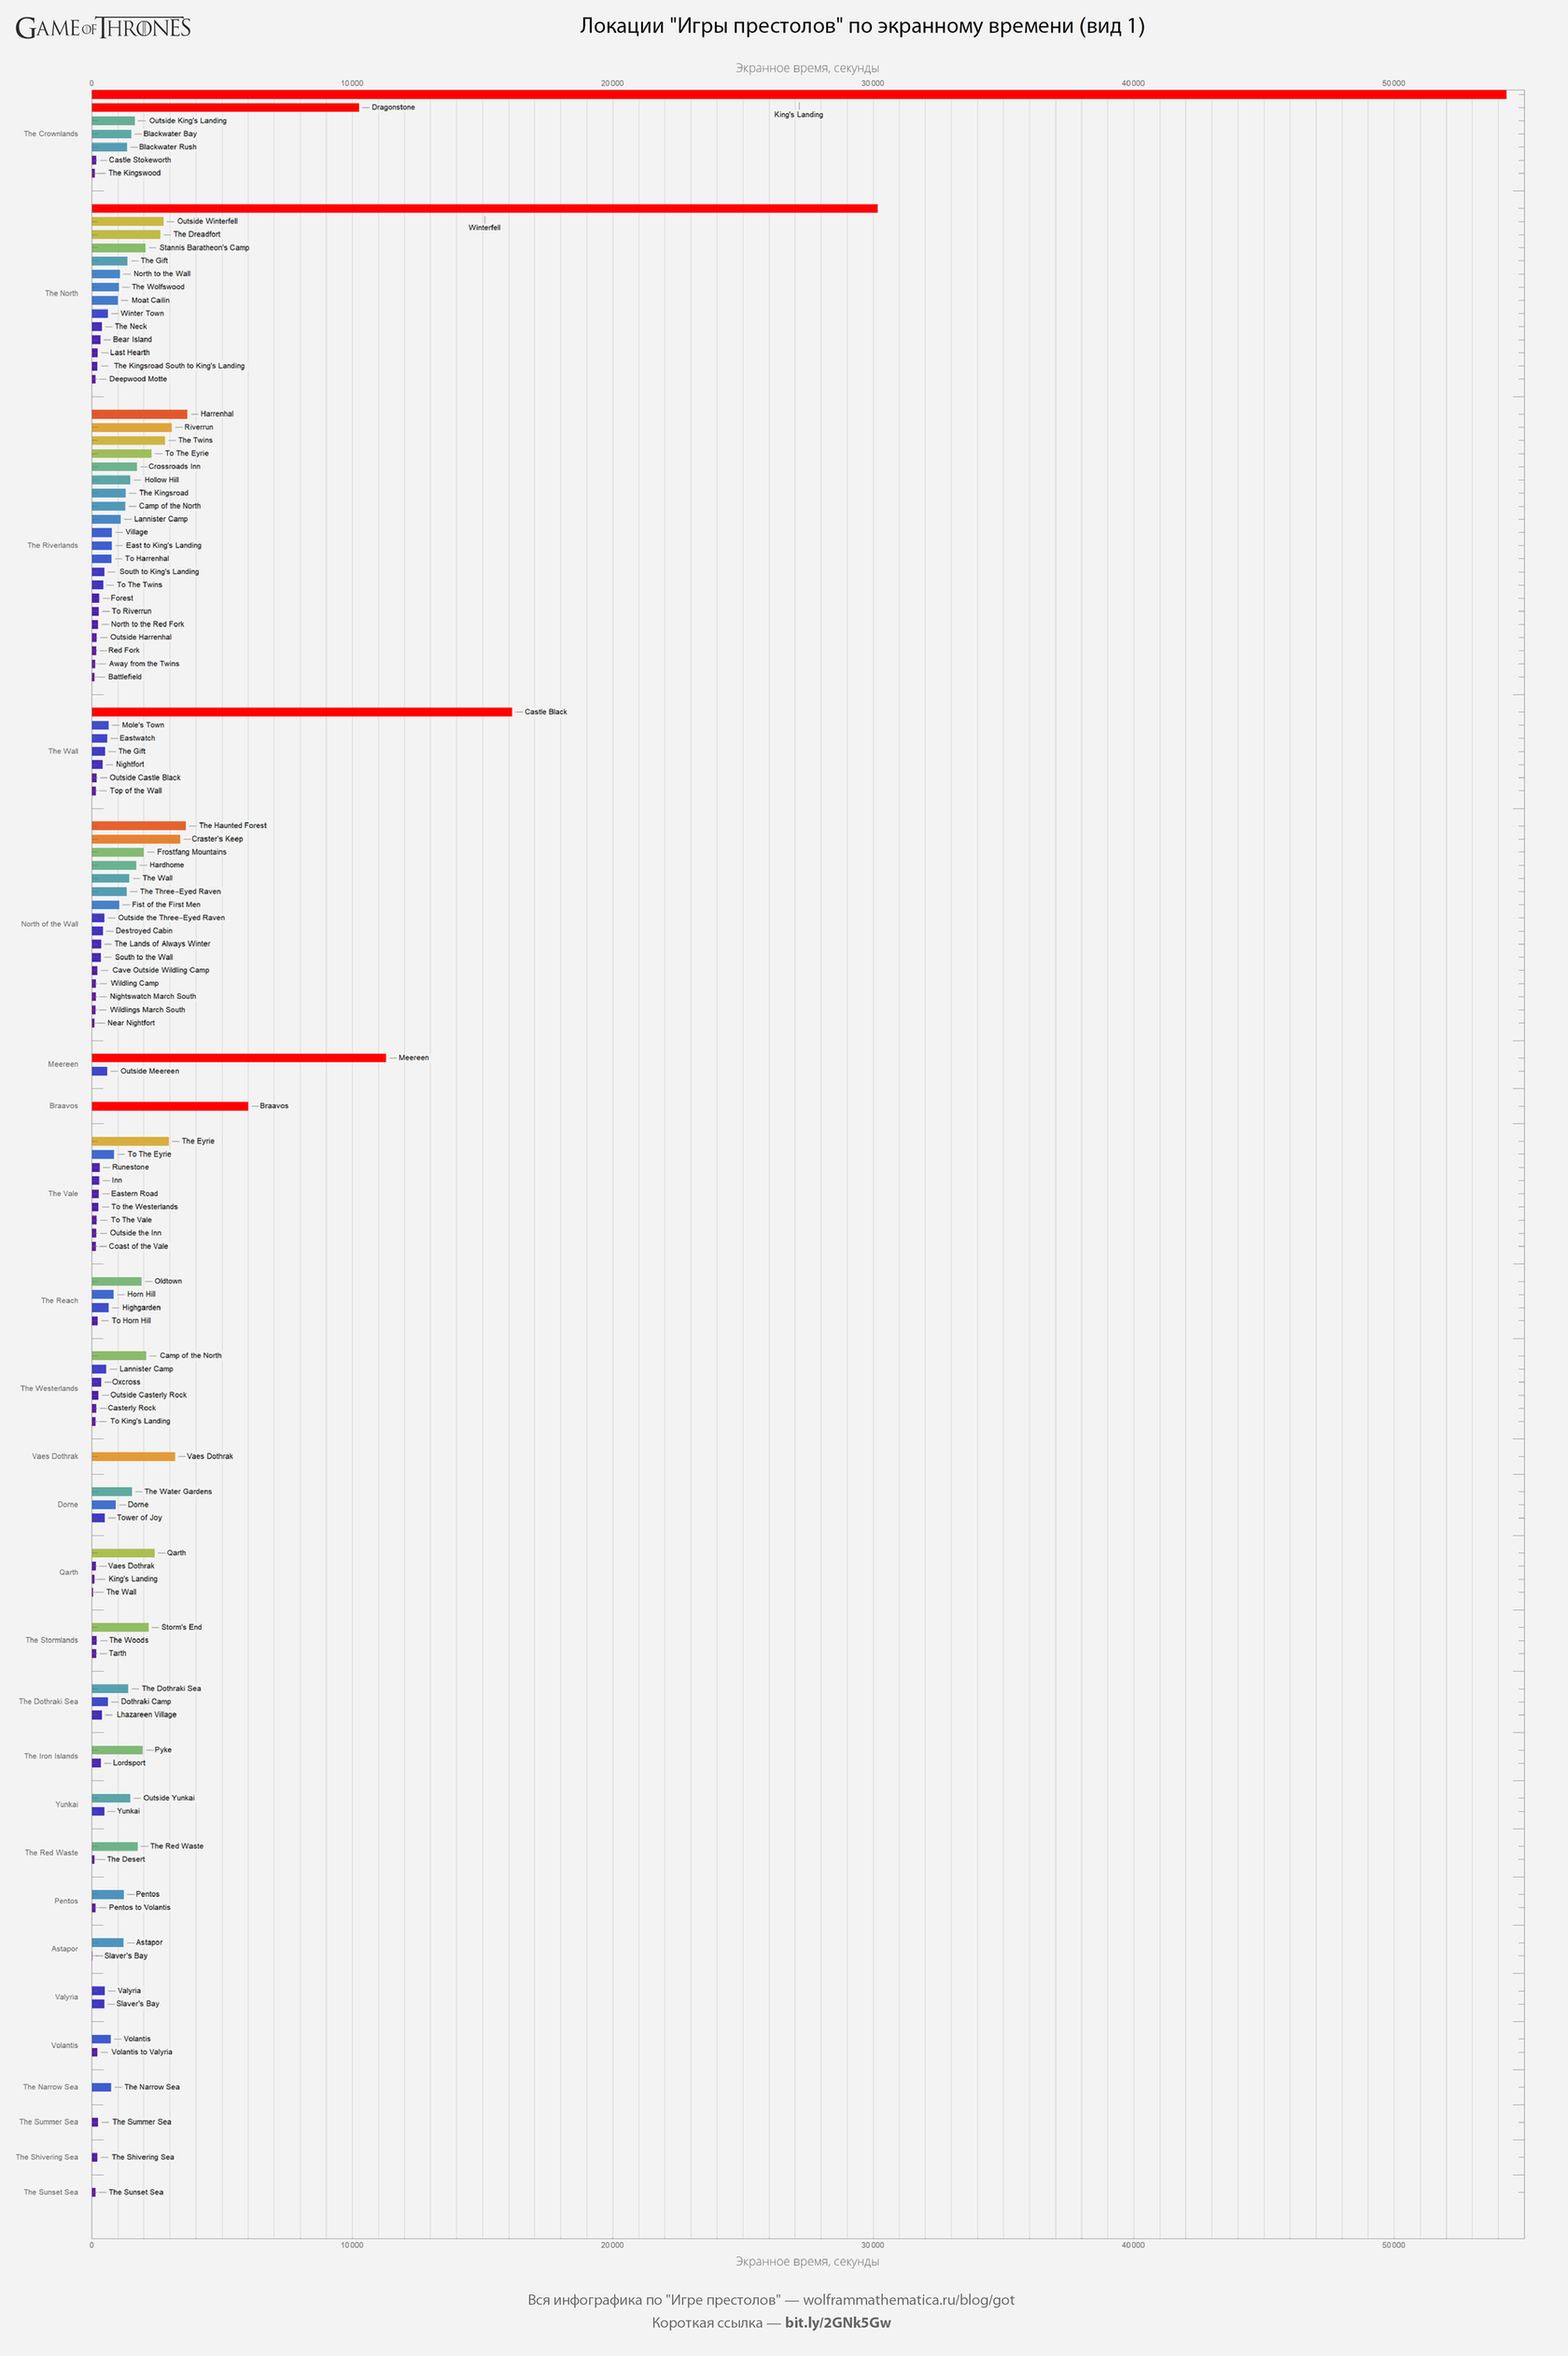
(original)
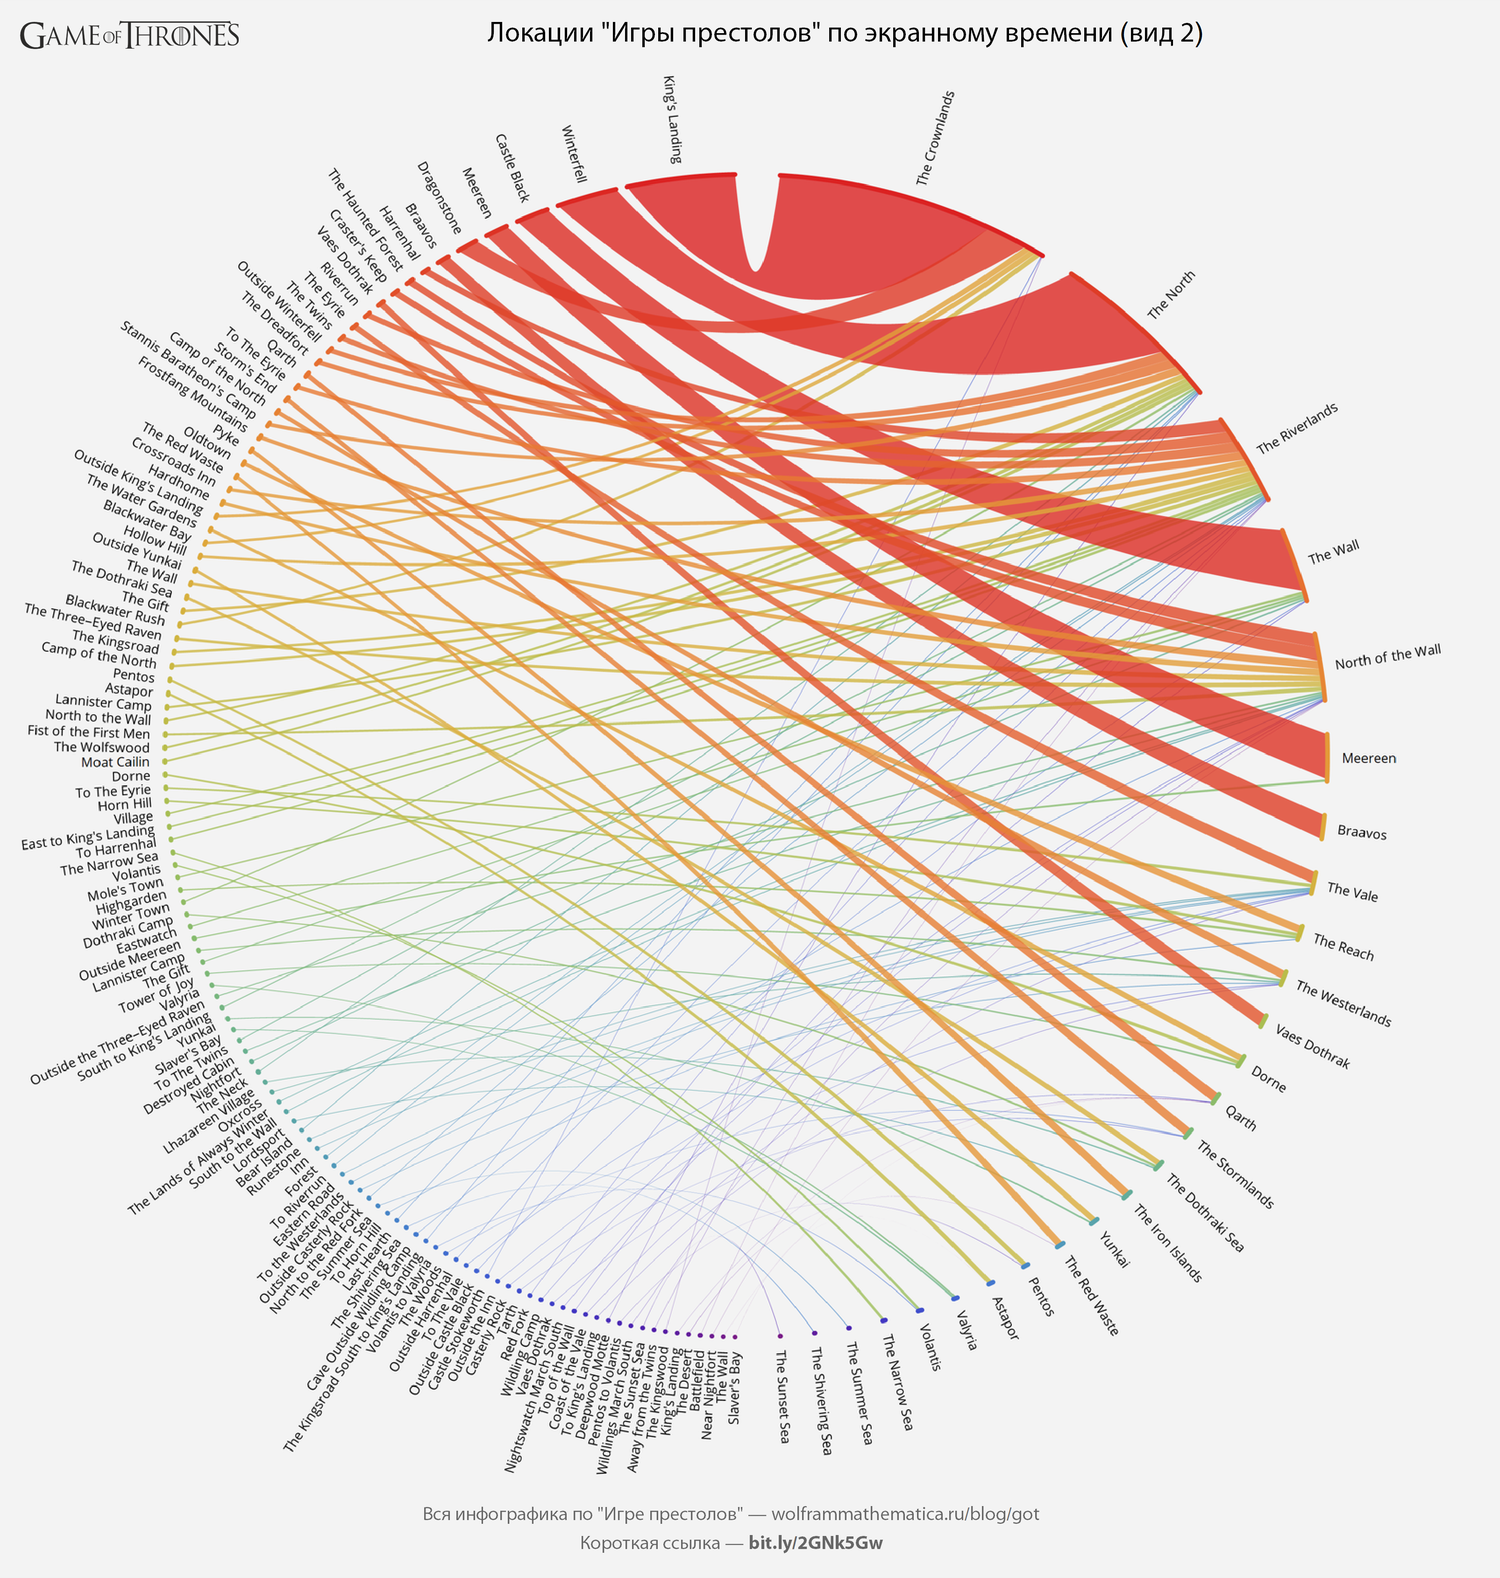
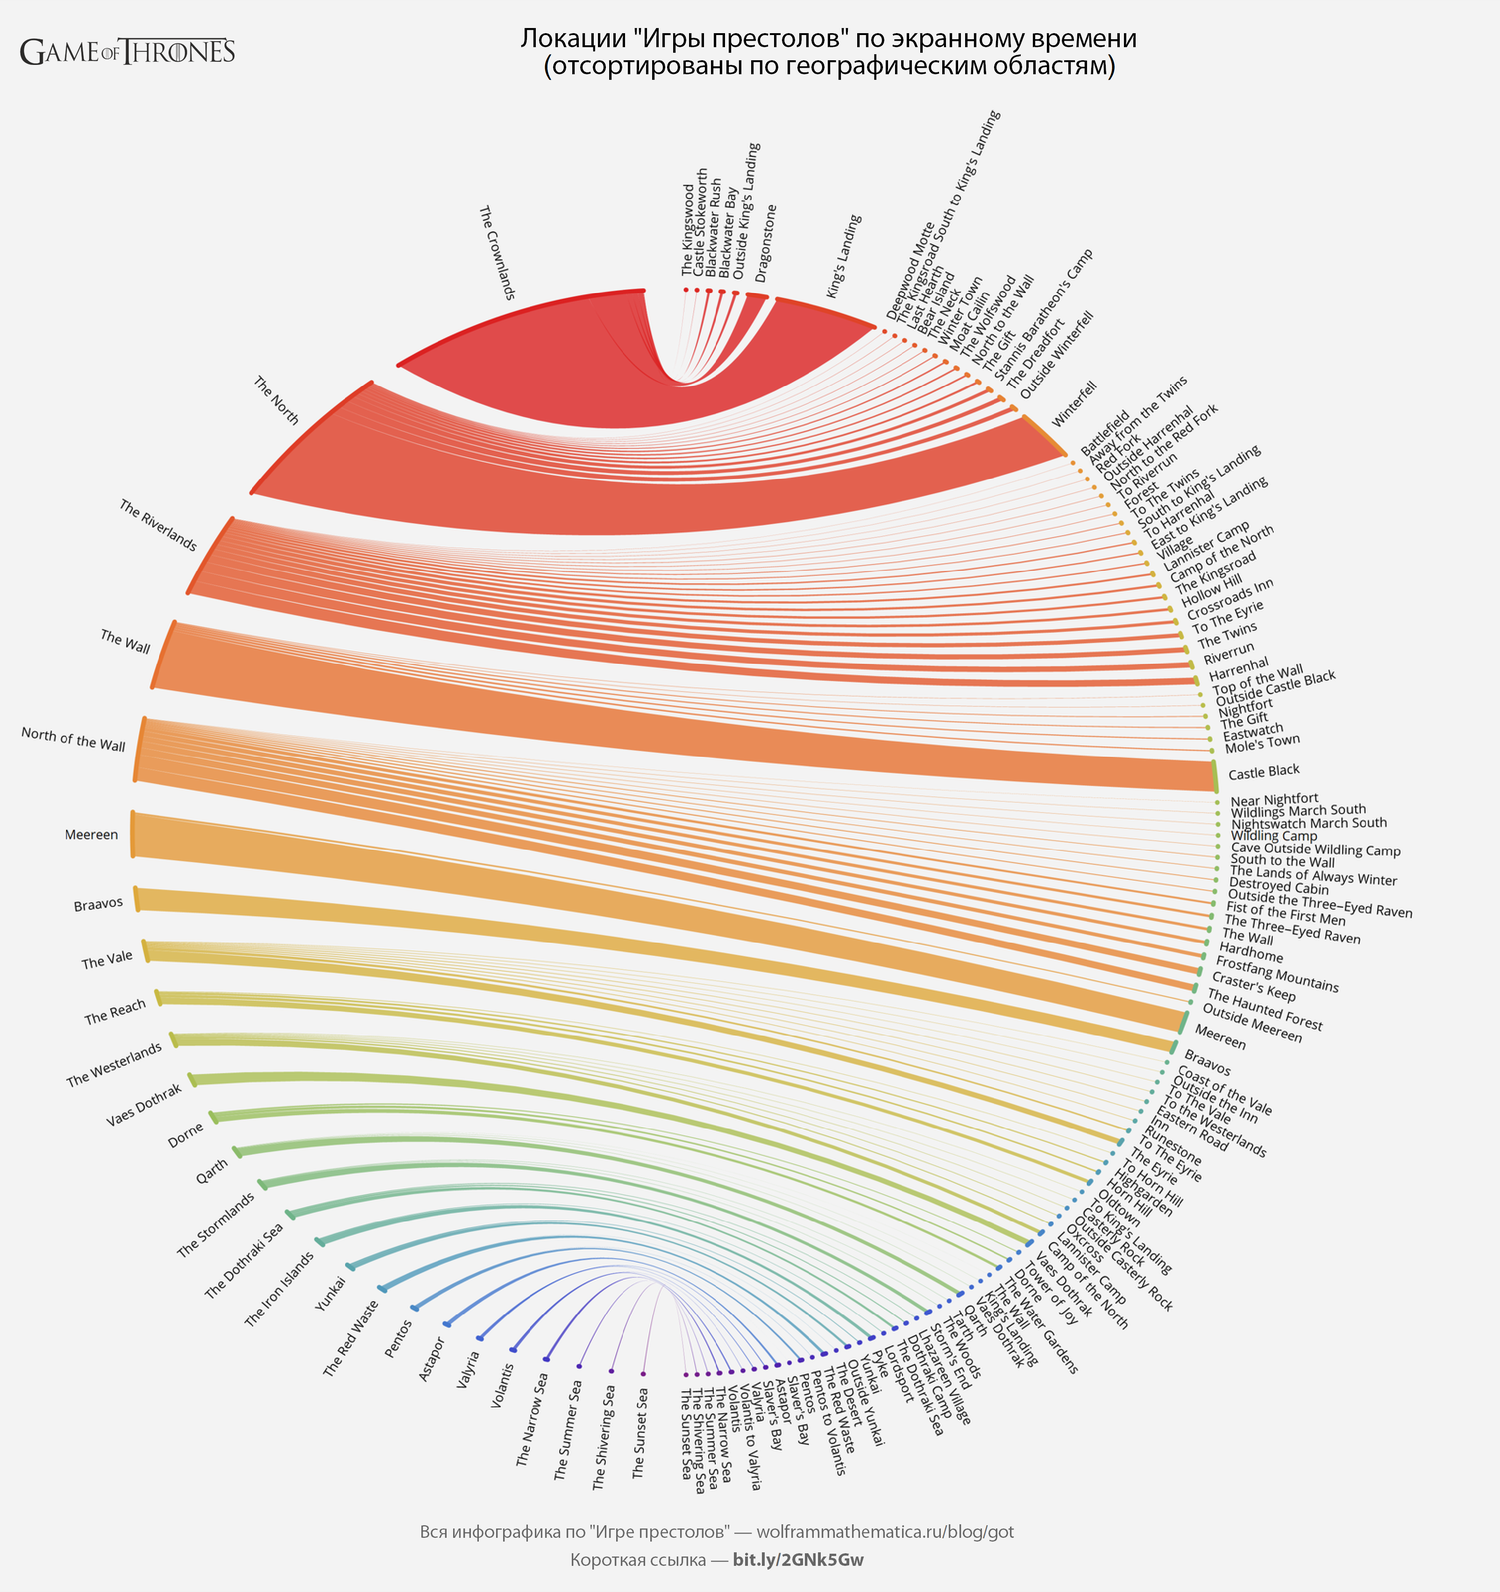
Data in the form of a circular pair diagram:
{
    Print[
        GOTInfographicsPoster[
            #1,
            "Локации "Игры престолов" по экранному времени (вид 2)",
            "ImageSize"->1500
        ]& @
            stripLineInfographics[
                #,
                "Reverse" -> False,
                "Gaps" -> {75,50},
                "ColorFunctionRight" -> ColorData["Rainbow"]
            ]],
    Print[
        GOTInfographicsPoster[
            #1,
            "Локации "Игры престолов" по экранному времениn(отсортированы по географическим областям)",
            "ImageSize"->1500
        ]& @
            stripLineInfographics[
                #,
                "Reverse" -> True,
                "Gaps" -> {50,75},
                "ColorFunctionRight" -> ColorData["Rainbow"]
            ]]} & @
    SorBy[
        GroupBy[
            KeyValueMap[
                {#1,#2}&,
                Merge[
                    $GOTEpisodeData[[All,"LocationTime"]],
                    Total[Flatten[Flatten[#]]&
                ]],
            #[[1,1]]&,
            SorBy[
                Transpose[
                    {
                        #[[;;,1]]/.
                        {{x_String, y_String}:> y, {x_String}:> x},
                        #[[;;,2]]}
                ]/.
                {"", _}:> Nothing,
                Last[#]&
            ]&
        ],
        -Total[#[#[[;;,2]]]&
    ];
(original)
(original)
In which films have the actors of the Game of Thrones played and how familiar are they?
Of course, the actors from the “Game of Thrones” are still playing a lot. Calculate and put in variable $ GOTCharactersInAnotherFilms data on which films which of the actors played.
$ GOTCharactersInAnotherFilms =
    SorBy[
        Map[
            {
                #[[1]],
                #[[2]][[;;,"characterName"]],
                If[
                    Head[#[[3]]]=== Missing,
                    0,
                    (* else *)
                    Stringring cases[#[[3]], DigitCharacter ..]/.
                    x _ /; Length[x]> 0:> ToExpression[x]
                ]/.
                {{x _}:> x, {} -> 0}
            } &,
            Lookup[
                Values[GOTRawData["costars.json"]],
                {"title", "actors", "year"}
            ]],
        -Length[#[#[[2]]]&
    ];
Now we calculate for each actor, in which films he played and put the result in the variable $ GOTCharactersFilmography.
$ GOTCharactersFilmography =
Association @
Sortby[
Select[
#->
SortBy[
Cases[
$GOTCharactersInAnotherFilms,
{film_,list_/;MemberQ[list,#], year _}:>
{film, year}
],
-Last[#]&
]& / @
$ GOTCharacters,
Length[#[#[[2]]]> 0 &
],
-Length[#[#[[2]]]&
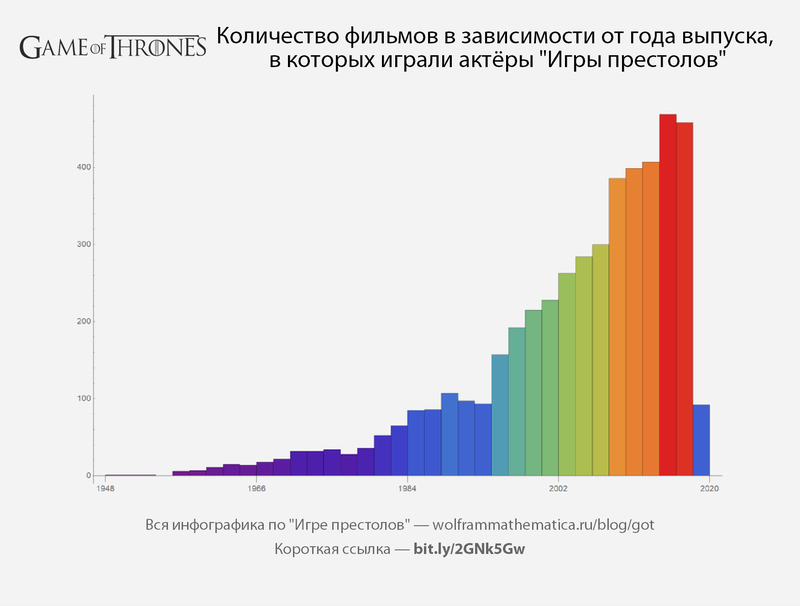
];Let us find out in the films of which release the actors of the Game of Thrones played:
GOTInfographicsPoster[
    #1,
    "Количество фильмов в зависимости от года выпуска, в которых играли актёры "Игры престолов"",
    "ImageSize"->800
]& @
    DateHistogram[
        DeleteMissing@
            Lookup[Values[GOTRawData["costars.json"]], "year"],
        ColorFunction -> "Rainbow",
        ImageSize-> 800,
        Background-> GrayLevel[0.95]
    ]
Films in which the most sought-after actors of the Game of Thrones played:
GOTInfographicsPoster[
    #1,
    "Фильмы в которых играли 20 самых "востребованных" актёров "Игры престолов"",
    "ImageSize"->1500
]& @
    Grid[
        {
            #/.$characterCardFull,
            TextCell[
                Grid[
                    KeyValueMap[
                        {#1/.{0->"неизв."},Row[#2," - "]} &,
                        Groupby[#Last#[#Last#[[;;,1]]&]],
                    Alignment -> {{Center, Left}, {Top, Top}}
                ],
                FontFamily -> "Open Sans Light",
                FontSize-> 14,
                TextAlignment-> Left,
                LineSpacing -> {0.9,0,0}
            ]& @
                $ GOTCharactersFilmography[#]
        } & / @
            $ GOTCharacters[[1;;20]],
        Alignment -> {{Center, Left}, Center},
        ItemSize -> {{20,70}, Automatic},
        Background-> GrayLevel[0.95],
        Dividers -> {None, {None, {Gray}, None}}
    ]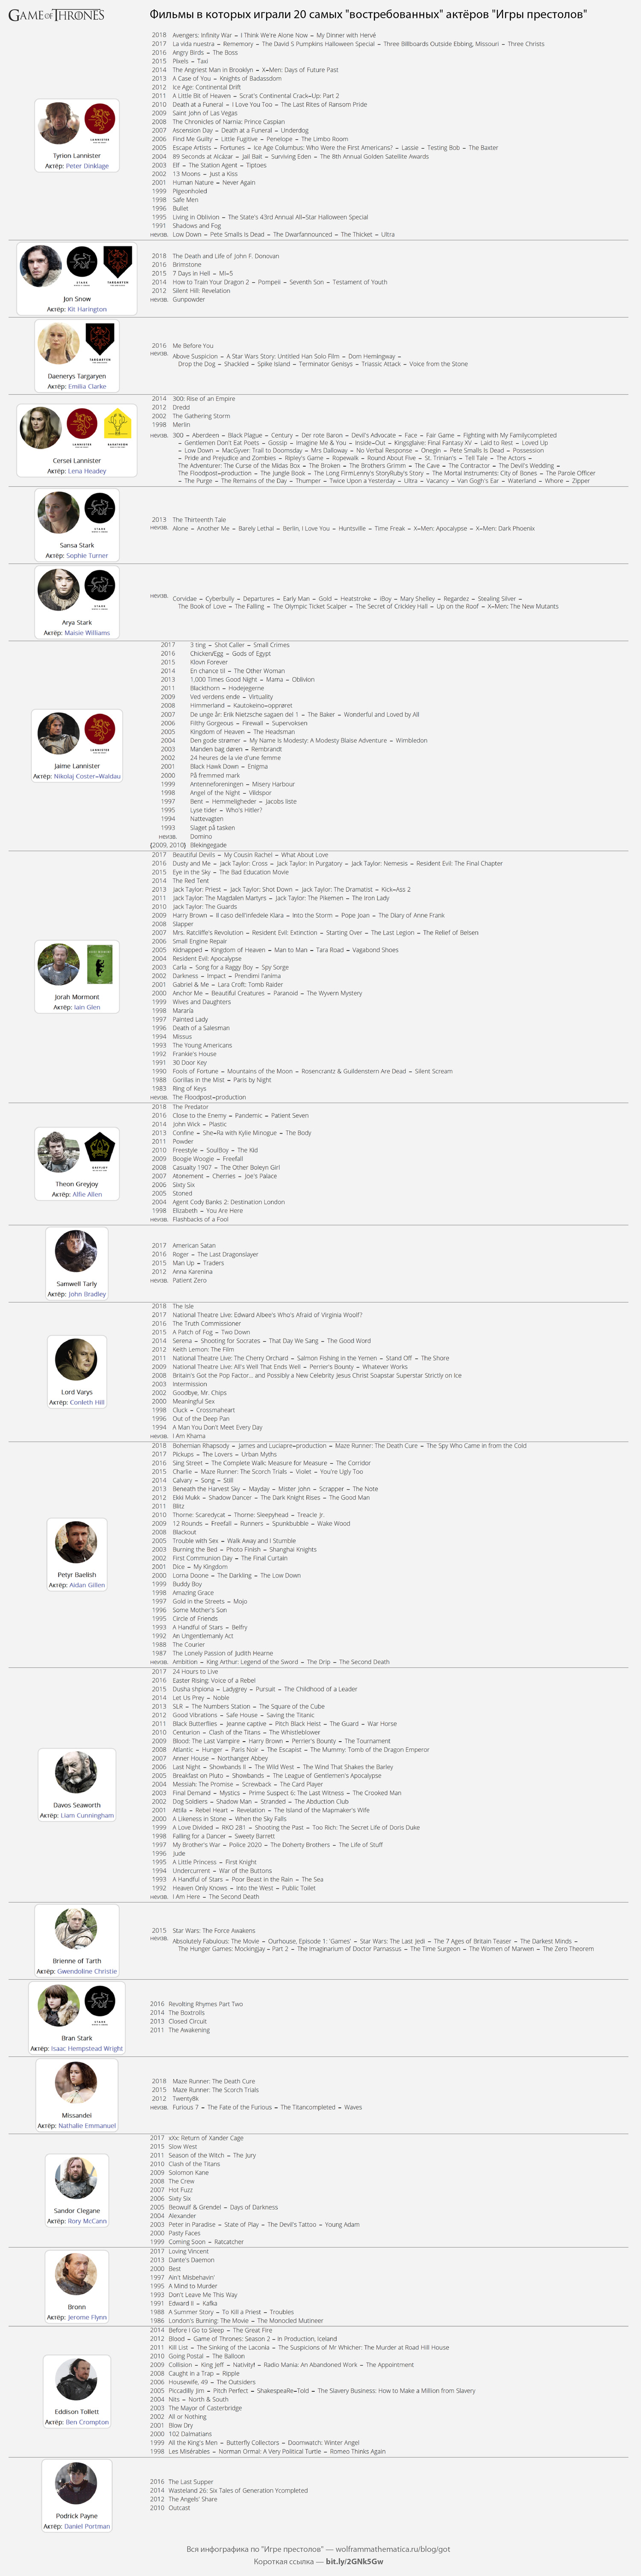
(original)
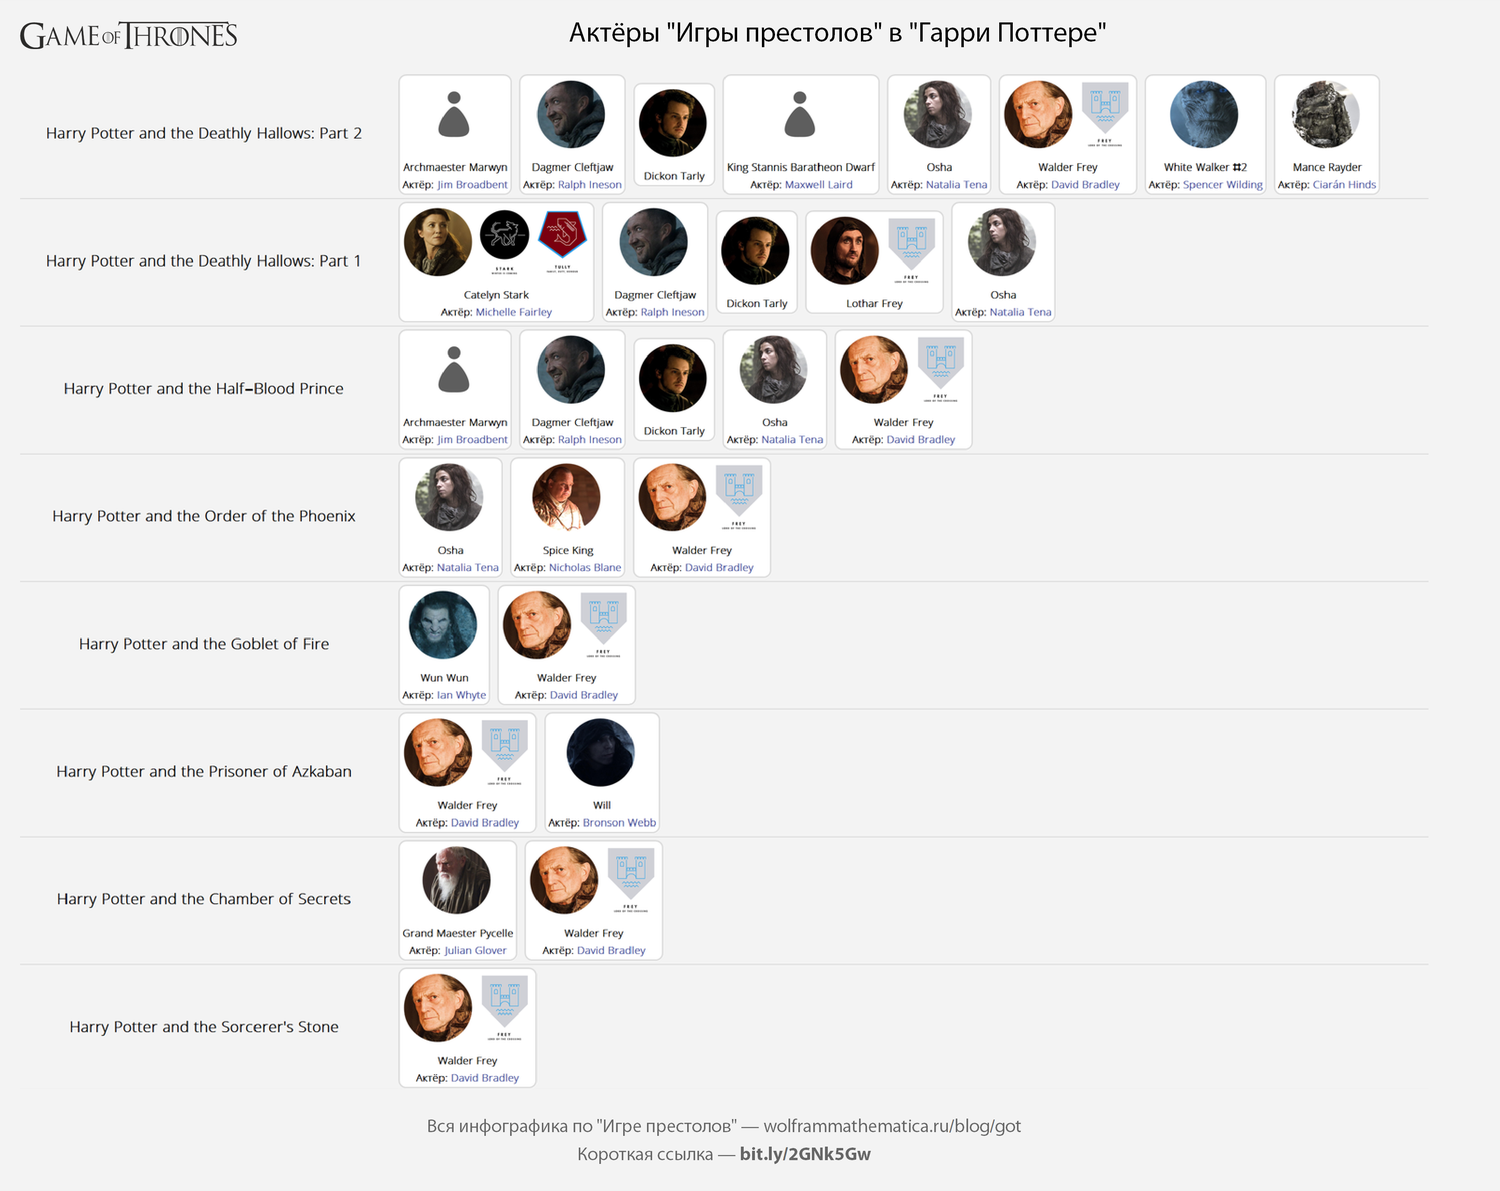
Actors "Game of Thrones" in "Harry Potter"
GOTInfographicsPoster[
    #,"Актёры "Игры престолов" в "Гарри Поттере"","ImageSize"->1500
]& @
    Grid[
        {
            Style[#[#[[1]], FontFamily -> "Open Sans Light", 16, Bold],
            Row[Magnify[#,0.75]& / @ (#[[2]]/.$characterCardFull), ""]} & / @
            Sortby[
                Select[
                    $ GOTCharactersInAnotherFilms,
                    StringMatchQ[
                        ToLowerCase @ #[[1]], ___ ~~ "harry potter" ~~ ___
                    ]&
                ],
                -Last[#]&
            ][
                [{1,-1,2,3,4,5,6,7}]
            ],
        Background-> GrayLevel[0.95],
        ItemSize -> {{25,70}, Automatic},
        Dividers -> {None, {None, {LightGray}, None}},
        Alignment -> {{Center, Left}, Center}
    ]
Actors "Game of Thrones" in "Star Wars"
GOTInfographicsPoster[
    #,
    "Актёры "Игры престолов" в "Звёздных войнах"",
    "ImageSize"->1100
]& @
    Grid[
        {
            Style[#[#[[1]], FontFamily -> "Open Sans Light", 16, Bold],
            Row[Magnify[#,0.75]& / @ (#[[2]]/.$characterCardFull), ""]} & / @
            SorBy[
                Select[
                    $ GOTCharactersInAnotherFilms,
                    StringMatchQ[
                        ToLowerCase @ #[[1]], ___ ~~ "star wars" ~~ ___
                    ]&
                ],
                -Last[#]&
            ],
        Background-> GrayLevel[0.95],
        ItemSize -> {{25,45}, Automatic},
        Dividers -> {None, {None, {LightGray}, None}},
        Alignment -> {{Center, Left}, Center}
    ]
Actors "Game of Thrones" in "Pirates of the Caribbean"
GOTInfographicsPoster[
    #,
    "Актёры "Игры престолов" в "Пиратах карибского моря"",
    "ImageSize"->1300
]& @
    Grid[
        {
            Style[#[#[[1]], FontFamily -> "Open Sans Light", 16, Bold],
            Row[Magnify[#,0.75]& / @ (#[[2]]/.$characterCardFull), ""]} & / @
            SorBy[
                Select[
                    $ GOTCharactersInAnotherFilms,
                    StringMatchQ[
                        ToLowerCase @ #[[1]], ___ ~~ "pirates of the" ~~ ___
                    ]&
                ],
                -Last[#]&
            ],
        Background-> GrayLevel[0.95],
        ItemSize -> {{25,50}, Automatic},
        Dividers -> {None, {None, {LightGray}, None}},
        Alignment -> {{Center, Left}, Center}
    ]
In which films / series there are many actors of "Game of Thrones"
GOTInfographicsPoster[
    #,
    "Фильмы (сериалы) в которых играет больше всего актёров "Игры престолов"",
    "ImageSize"->2000
]& @
    Grid[
        {
            Style[#[#[[1]], FontFamily -> "Open Sans Light", 16, Bold],
            Row[Magnify[#,0.75]& / @ (#[[2]]/.$characterCardFull), ""]} & / @
            SorBy[
                Select[$GOTCharactersInAnotherFilmsLength[#[$GOTCharactersInAnotherFilmsLength[#[[2]]]> 5 &],
                -Length[#[#[[2]]]&
            ],
        Background-> GrayLevel[0.95],
        ItemSize -> {{20,100}, Automatic},
        Dividers -> {None, {None, {LightGray}, None}},
        Alignment -> {{Center, Left}, Center}
    ]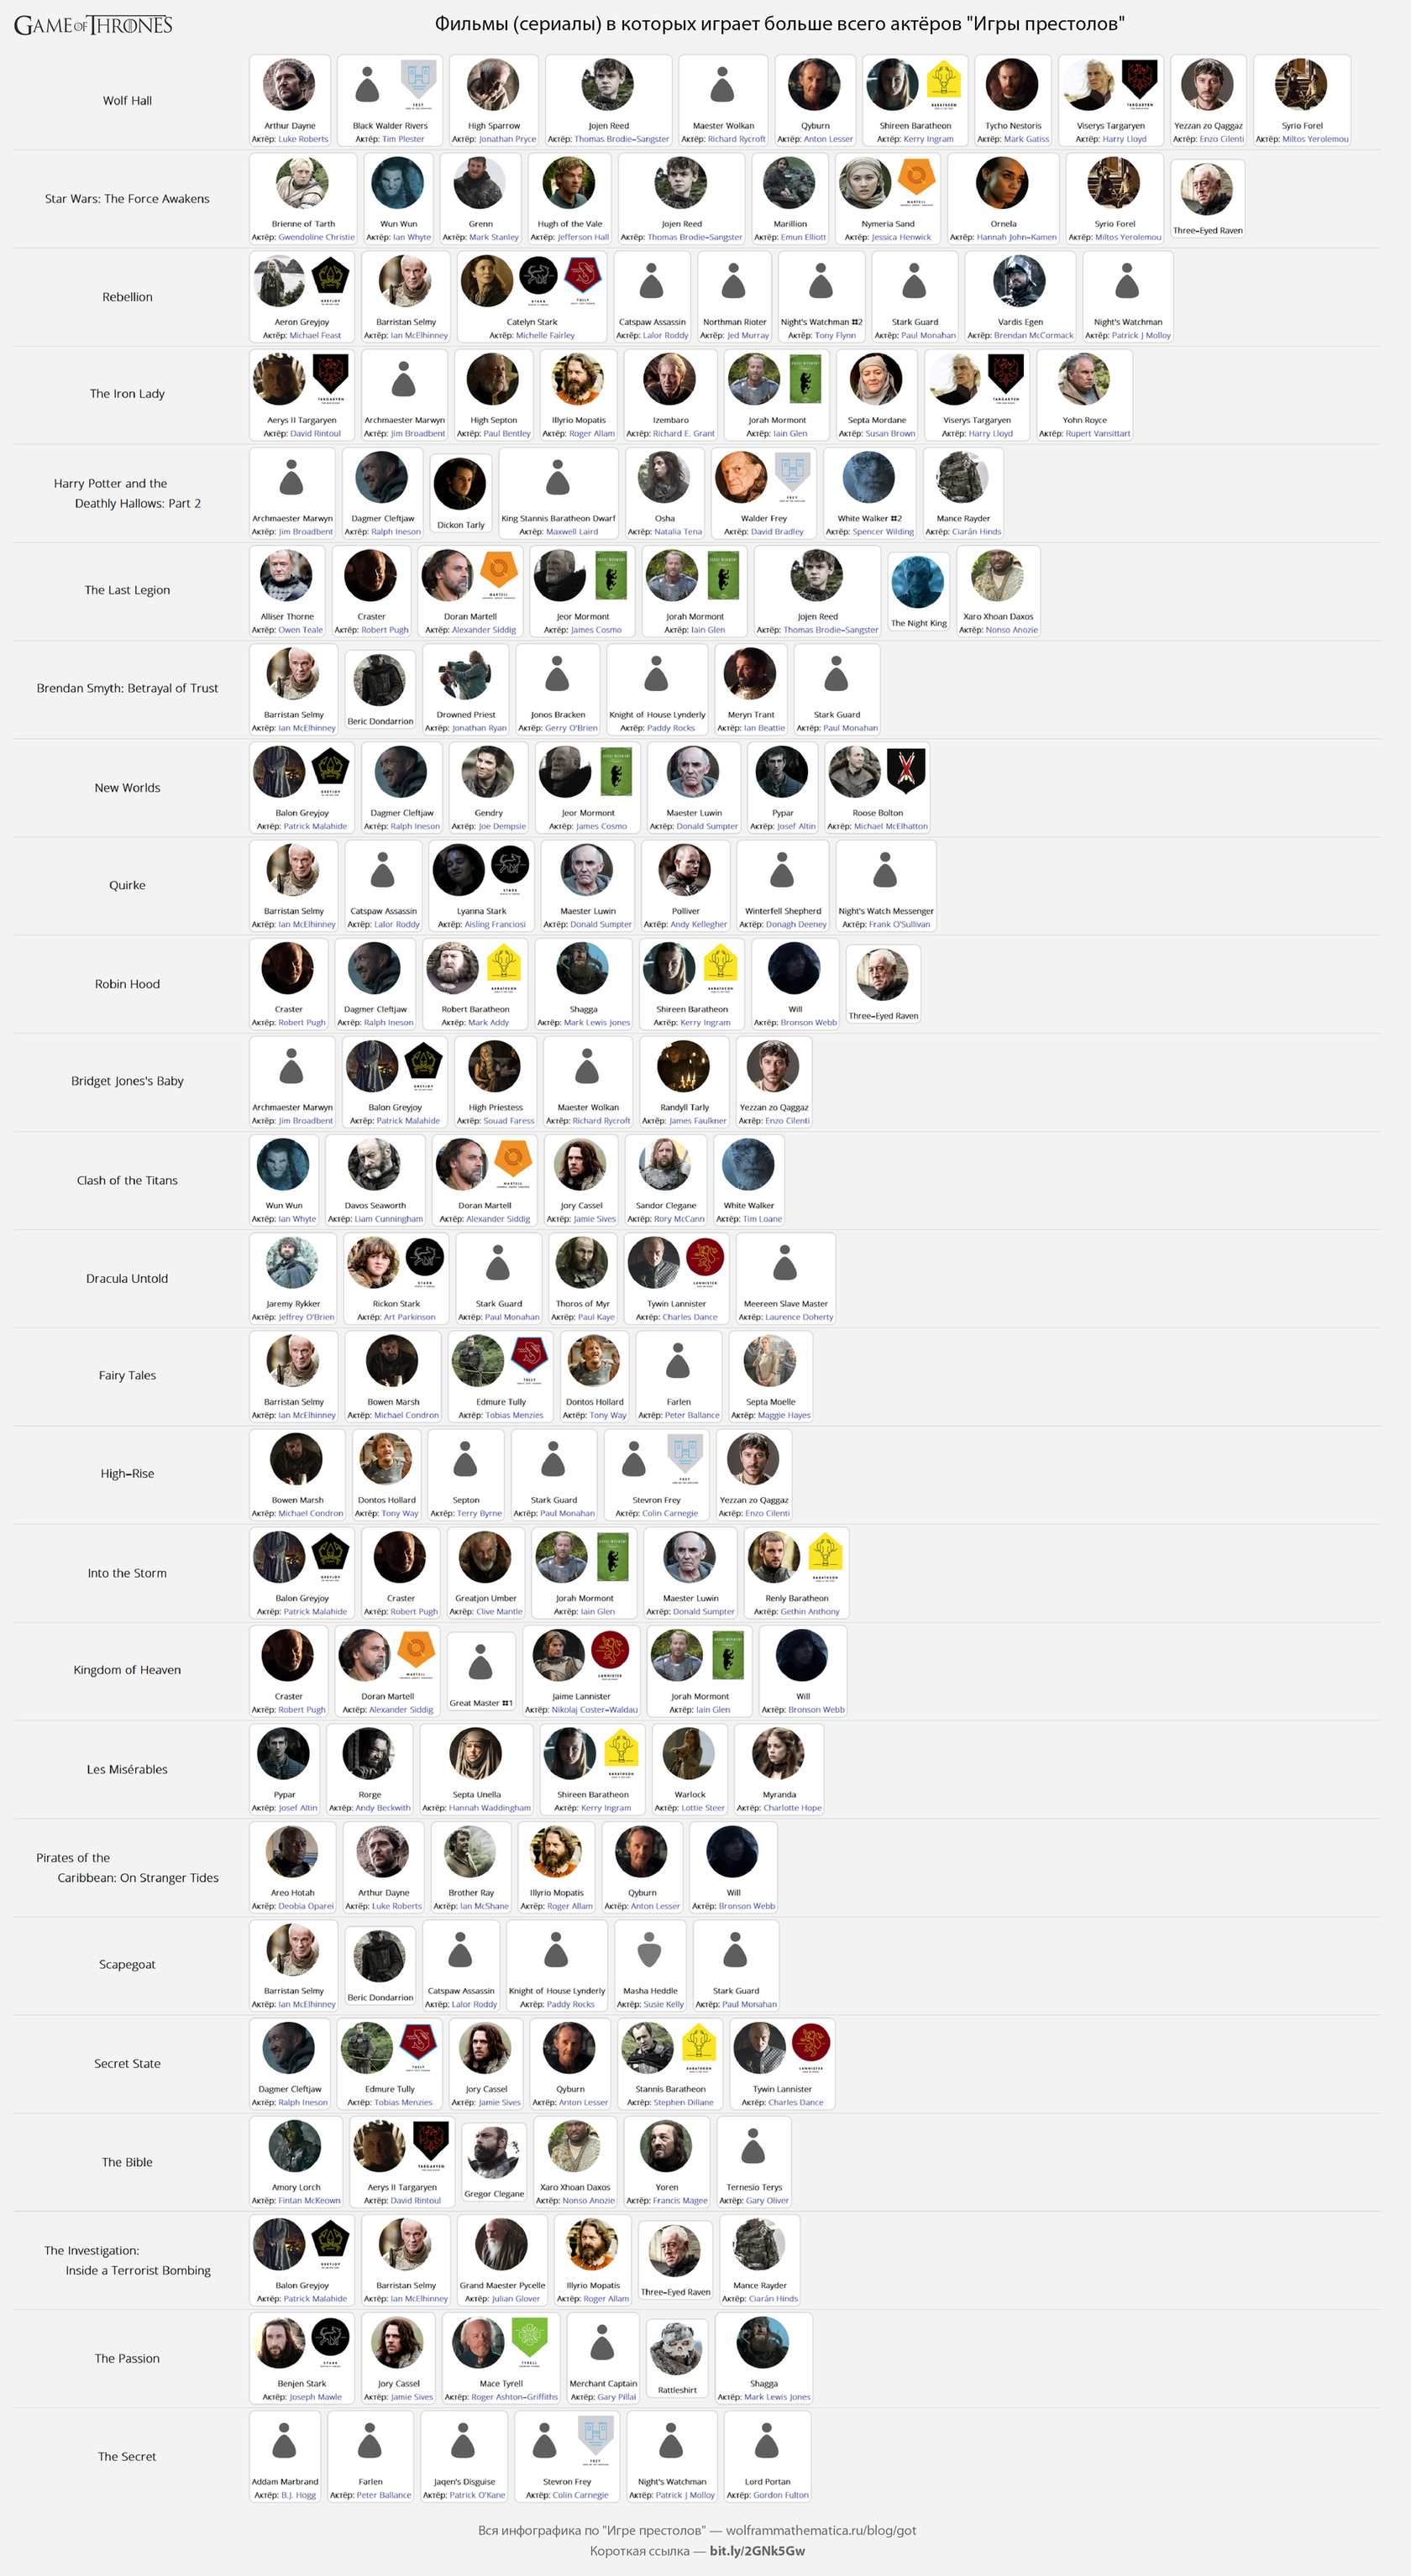
(original)
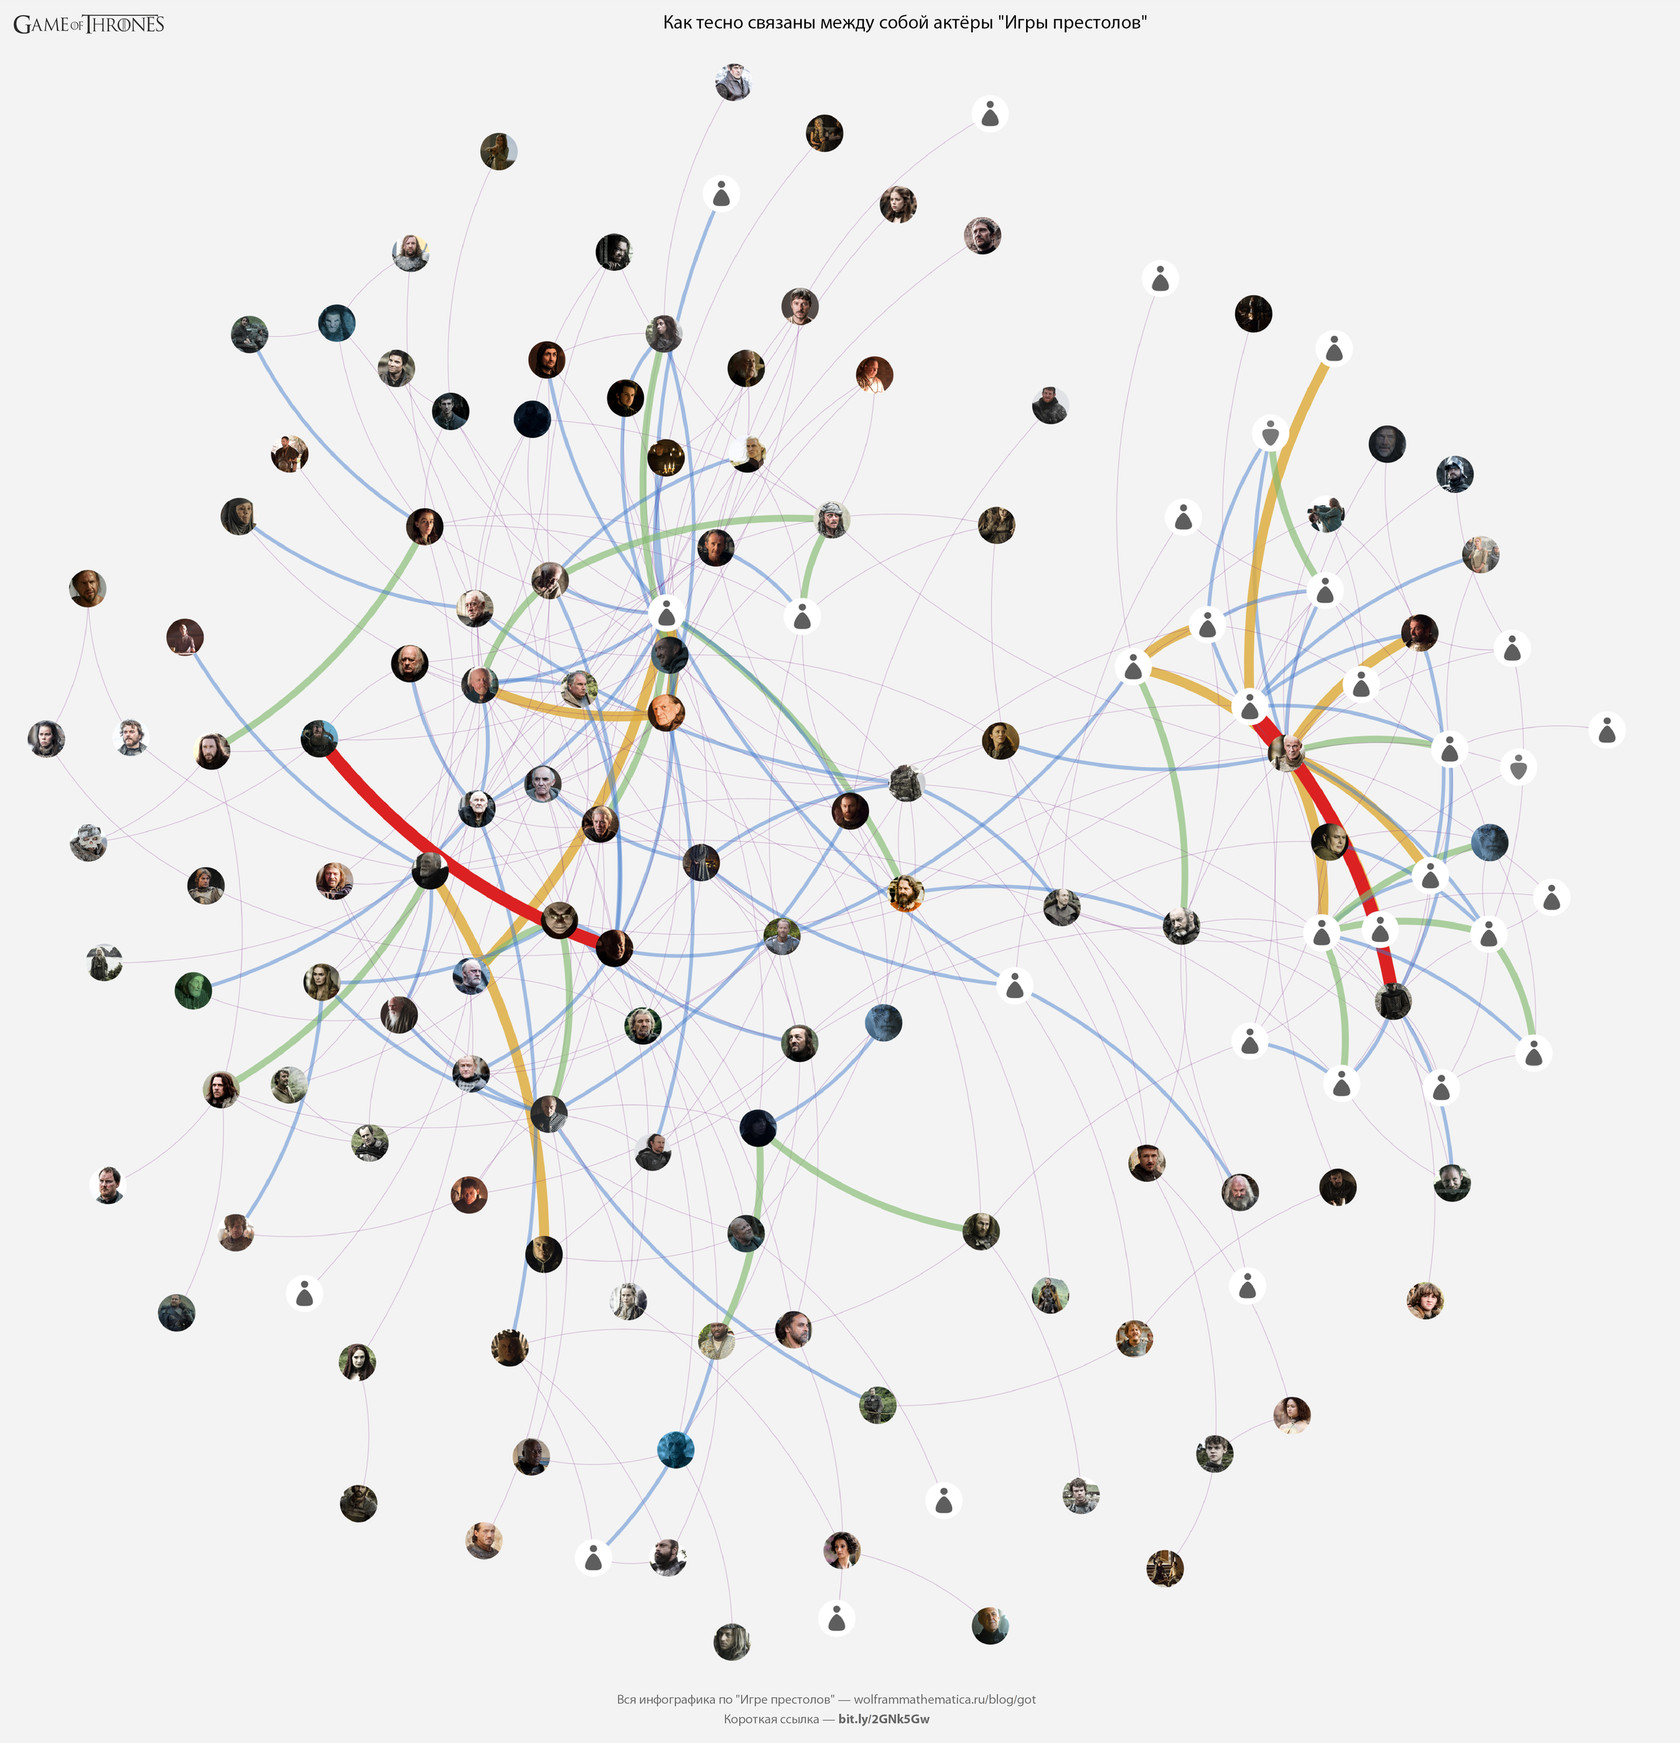
How closely are the actors of the Game of Thrones
Let's build a graph showing in how many pictures (movies, TV shows, etc.) the actors of “Game of Thrones” played together. The thicker and redder the line, the more common pictures of this pair of actors. (Original)
GOTInfographicsPoster[
    #,
    "Как тесно связаны между собой актёры "Игры престолов"",
    "ImageSize"->2500
]& @
    (
        ConnectedGraphComponents[
            GOTGraphPlot[#,1,"ImageSize"->2500,"MaxThickness"->20]
        ][
            [1]
        ]& @
            Tally[
                UndirectedEdge@@@
                    Map[
                        Sort,
                        Flatten[
                            Map[
                                Subsets[#,{2}]&,
                                Select[
                                    Values[GOTRawData["costars.json"]][
                                        [
                                        ;;,
                                        "actors",
                                        All,
                                        "characterName"
                                        ]
                                    ],
                                    Length[#]> 1 &
                                ]],
                            one
                        ]]])
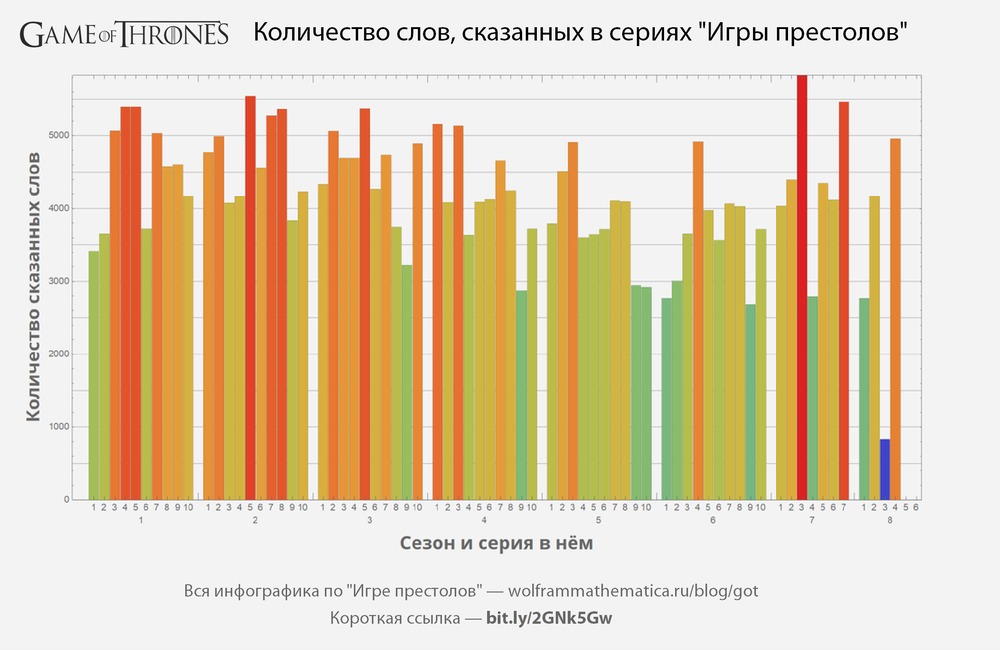
Talk in the "Game of Thrones"
Many people like the "Game of Thrones" for the dialogues. Let's see which series has them the most:
GOTInfographicsPoster[
    #,
    "Количество слов, сказанных в сериях "Игры престолов"",
    "ImageSize"->1000
]& @
    Barchart[
        #,
        BarSpacing -> {0.05,1},
        AspectRatio-> 1/2,
        ImageSize-> 1000,
        ChartLabels -> {Keys[#]Range[10]},
        ColorFunction-> Function[{x}ColorData[{x}ColorData["Rainbow"][x]],
        GridLines -> {None, Range[0,10000,500]},
        FrameLabel->
            Map[
                Style[#,FontFamily->"Open Sans",20,Bold]&,
                {"Season and series in it", "Number of words spoken"}
            ],
        Frame-> True,
        Background-> GrayLevel[0.95],
        PlotRangePadding-> 0,
        PlotRange-> All
    ]& @
    Groupby[
        Map[
            {#[[1;;2]]Total[#[[3]][[;;,"count"]]]} &,
            Lookup[
                GOTRawData["wordcount.json"]["count"],
                {"seasonNum", "episodeNum", "text"}
            ]],
        #[[1,1]]&,
        #[[;;,2]]&
    ]
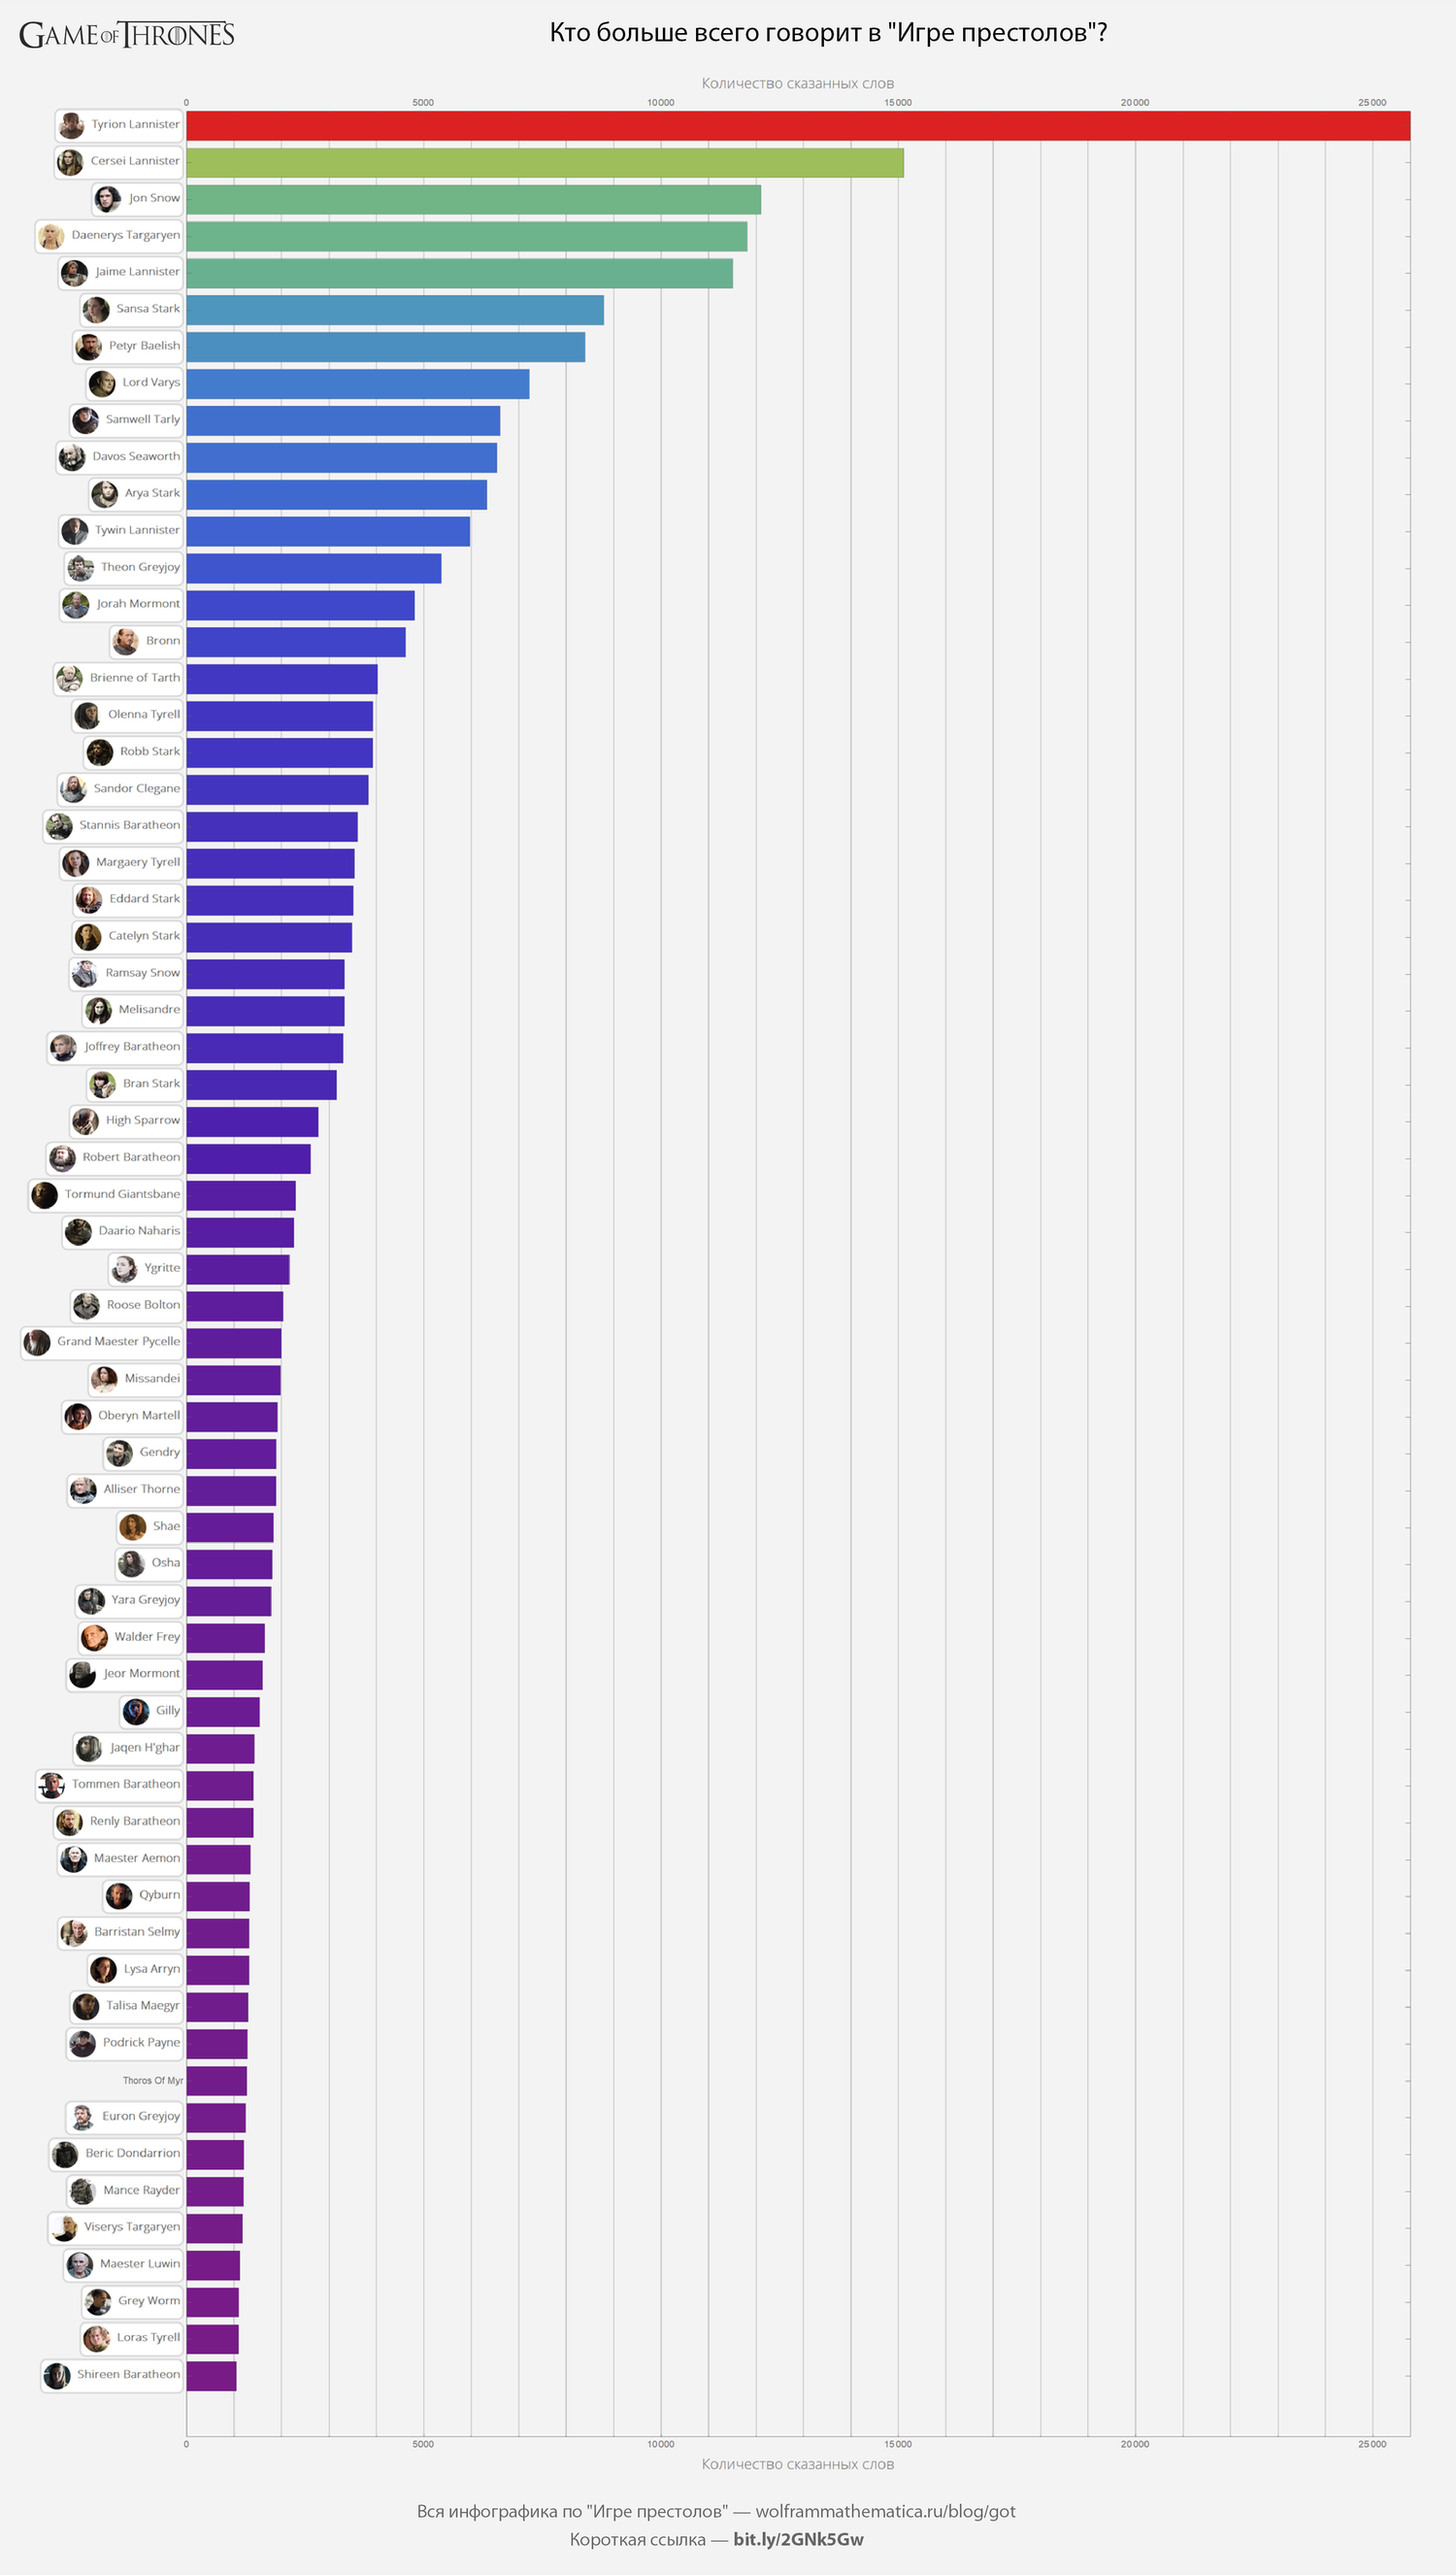
Let us find out who most “talks” in the “Game of Thrones” – the answer is quite predictable, but Tirion is almost 2 times surprised at the character’s closest to him.
GOTInfographicsPoster[
    #1,
    "Кто больше всего говорит в "Игре престолов"?",
    "ImageSize"->1500
]& @
    (
        (
            Barchart[
                #1[[1;;All,1]],
                PlotRangePadding-> 0,
                BarSpacing-> 0.25,
                BarOrigin-> Left,
                AspectRatio-> 1.9,
                ImageSize-> 1500,
                ChartLabels -> # 1[[1;;All,2]],
                Frame-> True,
                GridLines -> {Range[0,10^5,10^3], None},
                ColorFunction-> ColorData["Rainbow"],
                FrameLabel->
                    {
                        {None, None},
                        Style[#,FontFamily->"Open Sans Light",16]& / @
                            {
                                "The number of words spoken",
                                "The number of words spoken"
                            }
                    },
                FrameTicks -> {Automatic, {All, All}},
                Background-> GrayLevel[0.95]
            ]&
        )[
            KeyValueMap[
                {#2,#1/.$characterCardShortSmall}&,
                Select[
                    SortBy[
                        GroupBy[
                            Flatten[
                                GOTRawData["wordcount.json"]["count"][
                                    [;;,"text"]

                                ]],
                            #[[["name"]]&,
                            Total[#[#[[;;,"count"]]]&
                        ],
                        # &
                    ],
                    #> 1000 &
                ]]])
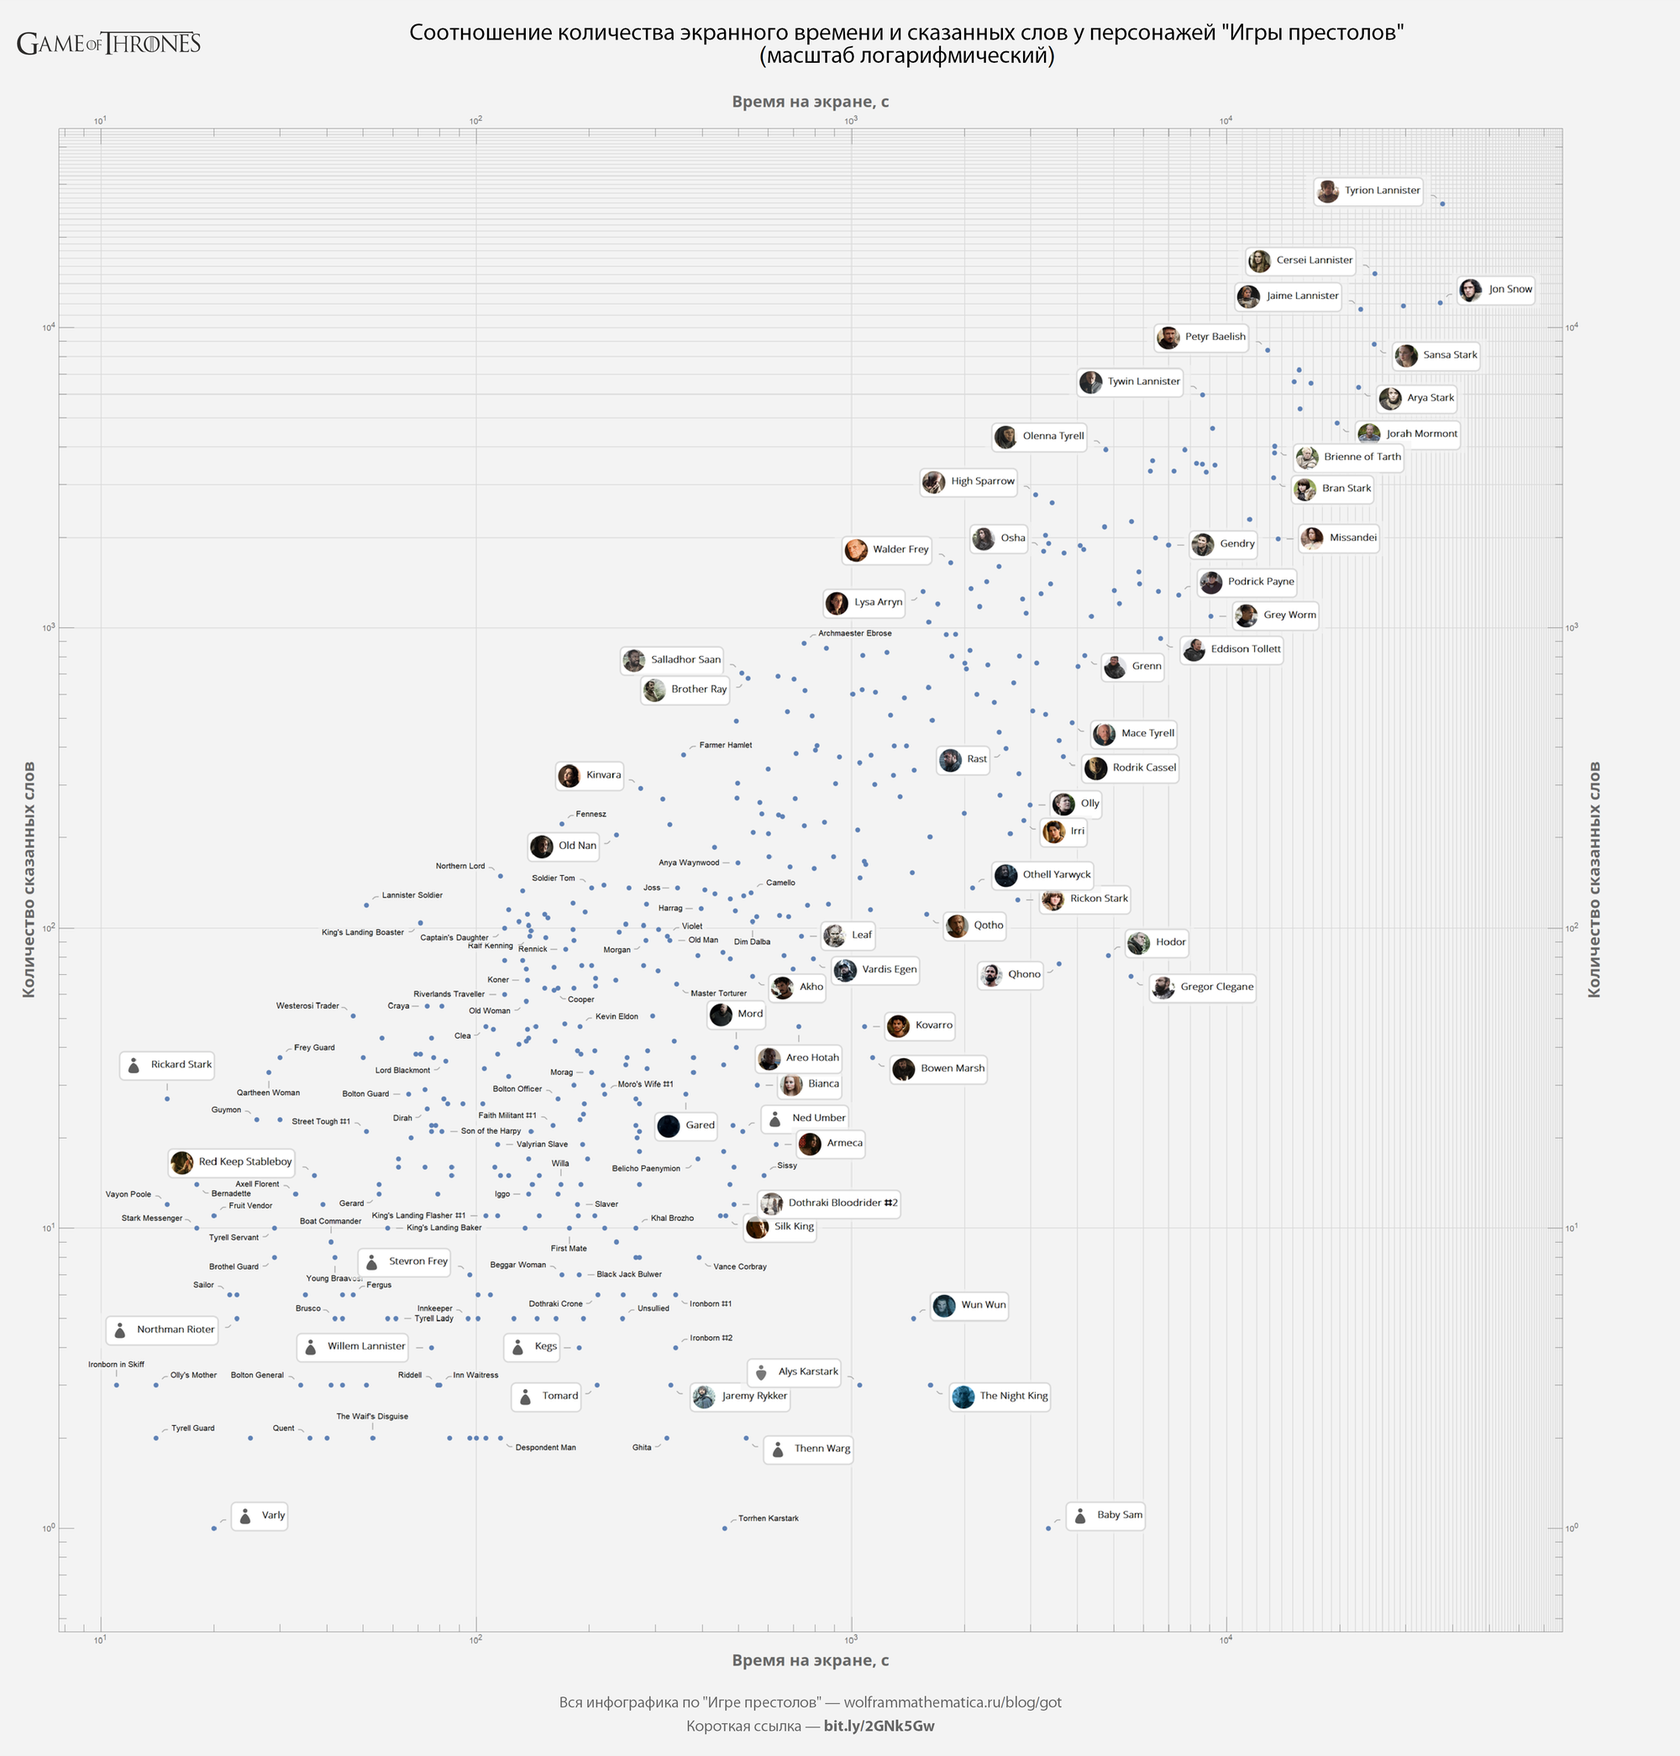
Finally, we construct a diagram showing the amount of screen time and the number of words spoken by the character:
GOTInfographicsPoster[
    #1,
    "Соотношение количества экранного времени и сказанных слов у персонажей "Игры престолов"n(масштаб логарифмический)",
    "ImageSize"->2000
]& @
    Module[{data1,data2,intersection},
        data1=
            Merge[
                $GOTEpisodeData[[;;,"ScreenTime"]]Total[Flatten[Flatten[#]]&
            ];
        data2 =
            Groupby[
                Flatten[
                    GOTRawData["wordcount.json"]["count"][[;;,"text"]]],
                #[[["name"]]&,
                Total[#[#[[;;,"count"]]]&
            ];
        intersection = intersection[Keys@data1,Keys@data2];
        Listplot[
            Callout[{data1[{data1[#], data2[#]}, # /. $ characterCardShortSmall]& / @
                intersection
            AspectRatio-> 1,
            ImageSize-> 2000,
            PlotRange-> All,
            ScalingFunctions -> {"Log10", "Log10"},
            GridLines->
                {
                    {10,100} ~ Join ~ Range[0,10^5,1000],
                    {10,100} ~ Join ~ Range[0,10^5,1000]
                },
            Frame-> True,
            FrameTicks-> All,
            FrameLabel->
                ReplaceAll[
                    {
                        {1,1}"Количество сказанных слов",
                        {1,1}"Время на экране, с"
                    },
                    x_String:>Style[x,FontFamily->"Open Sans",20,Bold]
                ],
            Background-> GrayLevel[0.95],
            PlotMarkers -> {Automatic, Small},
            GridLinesStyle-> GrayLevel[0.85]
        ]]
(original)
Gender of the characters of the Game of Thrones: who is more, men or women?
Gender by character name:
$ gender =    <|
    Flatten[
        KeyValueMap[
            Thread[#2->#one]&, GOTRawData["characters-gender-all.json"]
        ]]~
    Join
    ~
    {
        "Aegon Targaryen" -> "male",
        "Aerys II Targaryen" -> "male",
        "Archmaester Marwyn" -> "male",
        "Baratheon Guard" -> "male",
        "Brandon Stark" -> "male",
        "Child of the Forest" -> "male",
        "Elia Martell" -> "female",
        "Eon Hunter" -> "male",
        "Goldcloak # 1" -> "male",
        "Goldcloak # 2" -> "male",
        "Knight of House Frey" -> "male",
        "Knight of House Lynderly" -> "male",
        "Kurleket" -> "male",
        "Lannister Guardsman" -> "male",
        "Lord Galbart Glover" -> "male",
        "Male Prostitute" -> "male",
        "Masha Heddle" -> "female",
        "Meereen Slave Master" -> "male",
        "Mikken" -> "male",
        "Night's Watch Deserter" -> "male",
        "Night's Watch Messenger" -> "male",
        "Night's Watch Officer" -> "male",
        "Pentoshi Servant" -> "male",
        "Rhaella Targaryen" -> "female",
        "Rhaenys Targaryen" -> "female",
        "Stark Bannerman" -> "male",
        "Stark Guard" -> "male",
        "Wedding Band" -> "male",
        "White Walker # 2" -> "male",
        "Willis Wode" -> "male",
        "Young Ned" -> "male"
    } |>
The ratio of characters of the "Game of Thrones" by gender – it is clear that there are 3 men per woman. Sometimes it seems that male characters are only an entourage for powerful female ones).
GOTInfographicsPoster[
    #,"Соотношение мужских и женских персонажей в Игре престолов"
]& @
    Module[{labels,counts,percents},
        {labels,counts}=Transpose[Tally[Values[$gender]]];
        percents = PercentForm / @ N[counts/Total[counts]];
        Piechart[
            counts,
            ChartLabels->
                Map[
                    Style[
                        Row[#,"n"],
                        20,
                        Bold
                        Black,
                        FontFamily -> "Open Sans"
                    ]&,
                    Transpose[{labels,counts,percents}]
                ],
            ChartStyle -> {LightRed, LightBlue},
            ImageSize-> 600,
            Background-> GrayLevel[0.95]
        ]]
I remind you that here you can download the original post with all auxiliary functions and source data.