Economical APM for backend or how to use Loki+Grafana+application logs for APM
Problem
The API began to receive more and more load, it was necessary to analyze the work, and then optimize the work of a large backend. Typically, the process of optimizing a typical php backend includes:
optimization of SQL queries in the database;
optimizing work with the cache (increasing hitrate, increasing the amount of cached data);
optimization of internal processes in the backend (putting heavy processes into asynchronous mode, optimization of internal data structures)
All this has already been done, but did not give enough effect – the API was large, it had many services with different logic, complexity and connections. Spot improvements had an effect, but there was a desire to look at the entire backend from above – to evaluate data flows, evaluate the load created on each of the external storages (database, cache, services) and optimize based on the received data.
Already existing implementations of APM (newrelic, datadog, elastic apm agent, dynatrace, open tracing) were considered, but were not selected, as it was supposed to include external php extensions in the project, buy a license and / or raise additional nodes in the infrastructure.
I agree that for the purposes of APM, it’s not the analysis of logs that is more suitable, but a separate storage with aggregated data – metrics, on the basis of which graphs will be built – it’s faster, it lives longer (according to the period of access to data) and generally more correct. However, monitoring was implemented progressively, over several months, step by step changing the emphasis in the data, without any changes in the infrastructure. In part, it was also an experiment: how well log monitoring can be with minimal effort.
Solution
It was decided to use the application logs from nginx and the application server (php-fpm in this case), sent to loki, to store aggregated information on request-responses, which will therefore be aggregated by grafana + loki and on which graphs will be built.
In respect of:
Changing the format of nginx and php-fpm logs – added output of additional fields and change the format to json;
This is quite simple: everything is taken from the documentation: the format is corrected using log_format and access.format, respectively.Add logging of connection and execution of requests/commands with timing – to the database and cache in the application
It was not difficult, because the framework used allows you to override the base classes for commands and queries. The implementation is very framework dependent, but most often consists of overriding base interaction classes (pdo, cache) with simple$dbConnectionTime += $start_connection_time - microtime(true).Wrapping all external service calls into a gasket (named connector), which counts the call time, performs validation (including the structure) of the response, and logs the success of the call;
It was even useful, because now all calls to external systems (and there are already about 15 of them) are uniformly executed, validated and logged.
nginx log format and application
The nginx logs look pretty simple:
{
    "body_bytes_sent": "3186",
    "client_ip": "10.***.***.***",
    "client_req_id": "cad148c1-****-4819-****-035a4a9ace14",
    "connection": "10186566",
    "http_user_agent": "***",
    "pid": "16",
    "request_method": "POST",
    "request_time": "0.102",
    "request_uri": "/***/***/***?***=***",
    "request_uri_path": "/***/***/***",
    "status": "200",
    "time_local": "10/Apr/2023:23:27:15 +0300",
    "upstream_connect_time": "0.000",
    "upstream_header_time": "0.101",
    "upstream_response_time": "0.101",
    "uri": "/index.php"
}
nginx settings
// общие
http {
    // ...
    log_format json_upstream_logs escape=json '{"time_local":"$time_local","client_req_id":"$client_req_id","client_ip":"$client_ip","request_method":"$request_method","request_uri":"$request_uri","request_uri_path":"$request_uri_path","status":"$status","body_bytes_sent":"$body_bytes_sent","http_user_agent":"$http_user_agent","request_time":"$request_time","uri":"$uri","upstream_connect_time":"$upstream_connect_time","upstream_header_time":"$upstream_header_time","upstream_response_time":"$upstream_response_time","pid":"$pid","connection":"$connection"}';
    // ...
    map $request_uri $request_uri_path {
        "~^(?P<path>[^?]*)(\?.*)?$"  $path;
    }
}

// сервера
server {
    #Определение идентификатора запроса. если его нет в запросе - создаём
    if ($arg_client_req_id !~ $arg_client_req_id) {
        set $client_req_id $request_id;
    }
    if ($arg_request_id) {
        set $client_req_id $arg_request_id;
    }
    if ($arg_client_req_id) {
        set $client_req_id $arg_client_req_id;
    }
    #Определение ip адреса клиента
    # запросы приходят с проксирующего сервера, так что HTTP-заголовки приходят доверенные
    if ($http_x_real_ip !~ $http_x_real_ip) {
        set $client_ip $remote_addr;
    }
    if ($http_x_real_ip) {
        set $client_ip $http_x_real_ip;
    }


    location ~ ^/index\.php$ {
        // ..
        access_log  /var/log/nginx/access.log  json_upstream_logs;
        // ..
    }
}
The replaced php-fpm logs look pretty simple too:
{
    "C": "43.21",
    "M": "2097152",
    "P": "9",
    "Q": "",
    "R": "-",
    "RequestId": "f894d70d5910***3772a94261f7c40ca",
    "T": "20/Apr/2023:16:17:19 +0300",
    "d": "0.023",
    "f": "/var/www/html/web//index.php",
    "l": "42",
    "m": "POST",
    "n": "www",
    "p": "17",
    "q": "",
    "r": "/index.php",
    "s": "200",
    "t": "20/Apr/2023:16:17:19 +0300",
    "u": ""
}
php fpm settings
access.format="{"RequestId":"%{REQUEST_ID}e","C":"%C","d":"%d","f":"%f","l":"%l","m":"%m","M":"%M","n":"%n","P":"%P","p":"%p","q":"%q","Q":"%Q","r":"%r","R":"%R","s":"%s","T":"%T","t":"%t","u":"%u"}"Timings in the application
We add meta-information to all logs from the application (for the possibility of tracing logs between different services):
request id;
called service;
id of the authorized user, session;
First, we wrap everything: connections / execution of queries to the database, connections / execution of commands in the cache, we consider the time / amount of data.
From the received data, we form the first category of messages – timings, about the progress of the request. One message is generated for each request at the end of execution:
{
    "cacheCommands": 14,
    "cacheCommandsTime": 0.005800008773803711,
    "cacheConnectionTime": 0.0006201267242431641,
    "cacheReads": 7,
    "cacheReadsSize": 7989,
    "cacheWrites": 4,
    "cacheWritesSize": 1480,
    "dbConnectionTime": 0.0017120838165283203,
    "dbQueries": 5,
    "dbQueriesTime": 0.0563662052154541,
    "externalCalls": 1,
    "externalCallsTime": 0.03611111640930176
}
Calls to external services
On the success and execution time of requests to external services, we form the second category – external_calls – for each call according to the message in the log.
{
    "requestTime": 0.03611111640930176,
    "requestUrl": "http://10.***.***.***/***/***/***/***",
    "systemId": "***"
}
{
"error": "cURL error 28: Connection timeout after 1001 ms (see https://curl.haxx.se/libcurl/c/libcurl-errors.html): 0",
"request":
{
"body": "",
"url": "http://***.***.***:8280/***/***/***?***=***"
},
"requestTime": 1.0022687911987305,
"response": null,
"systemId": "***"
}Visualization
Then it remains only to arm yourself with logql, grafana and write queries that are true to the repository.
We start two variables that are selected in both dashboards (thus, the change of the studied circuit is implemented):
The entire APM is divided into two dashboards:
performance status. To evaluate “how well everything is doing.”
Remote Calls. To study interaction with other services.
performance status
Consists of the following blocks:
API response statistics by individual services/response codes.
RPS. Count of requests to the entire API, divided by nginx response codes.
summary for {code}. Select any response codes from the grafana drop-down list, on the basis of which it will be built:
Average Response time (nginx/fpm).
response time. Response percentiles based on nginx data.
Response count by path for {code}. Number of service responses for the selected response code.
Response size by path. Average response size of services.
Response time by path. Average service response time.
What does it look like

How is formed
{{status}}: sum by (status) (rate($nginx_source | json | error != "JSONParserErr"[1s]))

How is formed
avg by nginx – {{status}} |
|
connect_time – {{status}} |
|
header_time – {{status}} |
|
response_time – {{status}} |
|
avg by php-fpm – {{s}} |
|

How is formed
max by nginx – {{status}} |
|
95% by nginx – {{status}} |
|
90% by nginx – {{status}} |
|
70% by nginx – {{status}} |
|
50% by nginx – {{status}} |
|
30% by nginx – {{status}} |
|

How is formed
{{request_uri_path}}: sum by (request_uri_path) (rate($nginx_source | json | __error__ != "JSONParserErr" | status=$http_code [1s]))

How is formed
{{request_uri_path}}: avg_over_time($nginx_source | json | __error__ != "JSONParserErr" | unwrap body_bytes_sent | __error__=""[1s]) by (request_uri_path)

How is formed
{{request_uri_path}}: avg_over_time($nginx_source | json | __error__ != "JSONParserErr" | unwrap request_time | __error__=""[1s]) by (request_uri_path)
Summary statistics of the application in the context of individual storages (according to fpm data).
DB/cache/calls summary. Spending time by the application on various activities: working with the database, cache and other services.
queries and commands. The number of requests, reads/writes from the cache.
cache size. The amount of data read/written to the cache.
External calls summary. Distribution of work time with external services.
What does it look like

How is formed
connect to dbtime |
|
db queries time |
|
connect to cache time |
|
cache time |
|
external calls time |
|

How is formed
db queries |
|
cache commands |
|
cache reads |
|
cache writes |
|

How is formed
read from cache |
|
write to cache |
|

How is formed
{{request_uri_path}}: avg_over_time($fpm_source |=`:"external_calls"` | json | __error__ != "JSONParserErr" | unwrap message_requestTime | __error__=""[1s]) by (message_systemId)
Statistics of work with the database in the context of individual services.
Db time. Working time with the database is average.
DB queries count. The average number of queries to the database.
What does it look like

How is formed
{{request_uri_path}}: avg_over_time($fpm_source |=`:"timings"` | json | __error__ != "JSONParserErr" | unwrap message_dbQueriesTime | __error__=""[1s]) by (method)

How is formed
{{request_uri_path}}: avg_over_time($fpm_source |=`:"timings"` | json | __error__ != "JSONParserErr" | unwrap message_dbQueries | __error__=""[1s]) by (method)
Statistics of work with the cache in the context of individual services.
Cache commands time. Average cache time.
Cache commands count. Average number of instructions to the cache.
Cache write size. Average cache entry size.
Cache reads size. Average cache entry size.
What does it look like

How is formed
{{request_uri_path}}: avg_over_time($fpm_source |=`:"timings"` | json | __error__ != "JSONParserErr" | unwrap message_cacheCommandsTime | __error__=""[1s]) by (method)

How is formed
{{request_uri_path}}: avg_over_time($fpm_source |=`:"timings"` | json | __error__ != "JSONParserErr" | unwrap message_cacheCommands | __error__=""[1s]) by (method)

How is formed
{{request_uri_path}}: quantile_over_time(0.9, $fpm_source |=`:"timings"` | json | __error__ != "JSONParserErr" | unwrap message_cacheWritesSize | __error__=""[1s]) by (method)

How is formed
{{request_uri_path}}: quantile_over_time(0.9, $fpm_source |=`:"timings"` | json | __error__ != "JSONParserErr" | unwrap message_cacheReadsSize | __error__=""[1s]) by (method)
Statistics of work with other APIs in the context of individual services.
External calls time. Working time with external services.
What does it look like

How is formed
{{request_uri_path}}: avg_over_time($fpm_source |=`:"timings"` | json | __error__ != "JSONParserErr" | unwrap message_externalCallsTime | __error__=""[1s]) by (method)
Utilization of CPU and memory by workers.
PHP avg memory & CPU.
What does it look like

How is formed
php cpu cons. % – {{s}} |
|
php memcons. – {{s}} |
|
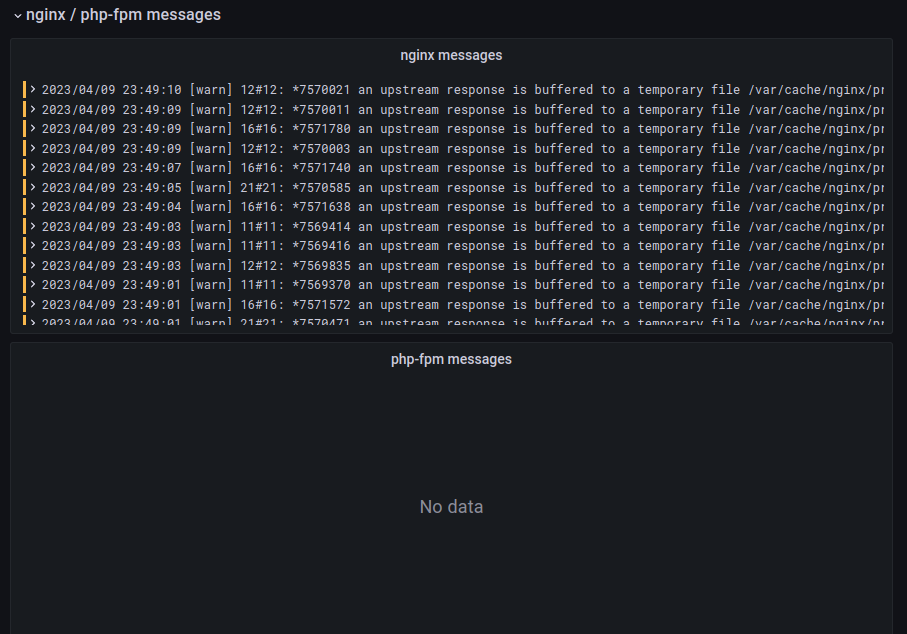
Non-standard nginx / fpm logs.
nginx messages. All messages from nginx that are not access logs.
php fpm messages. The same, only for php.
What does it look like
How is formed
nginx logs |
|
php fpm logs |
|
Summary of application exceptions.
Exceptions. All lines from application logs that contain Exception.
Exception messages. Detailed log lines with Exceptions to study right on the spot.
What does it look like

How is formed
{{category}}: sum by (category) (rate($fpm_source |=`Exception` | json | __error__ != "JSONParserErr" [1s]))
external calls
Consists of a variable number of blocks, each of which contains a summary of the interaction with one external service that the monolith is accessing.
RPS chart & avg. time + errors. Graph that shows:
The number of successful responses from the service.
Average and maximum response time of the service.
Errors (grouped by type) when accessing the service, parsing the response, parsing the response.
Service call logs. All cases are listed in reverse chronological order.
What does it look like

How is formed
Successful Requests | {{message_systemId}} |
|
Failed Requests | errored – {{message_systemId}} : {{message_error}} |
|
Average execution time | avg request time – {{message_systemId}} |
|
Maximum execution time | max request time – {{message_systemId}} |
|

How is formed
$fpm_source |=`external_calls` |=`systemId":"$external_system` | json | __error__ != "JSONParserErr" | line_format "{{.timestamp}}: {{ printf "%s" .message_requestTime }} {{ .message_error }}"
conclusions
It turned out to build your APM from improvised means.
It has downsides:
Short period of data storage; we fill the already heavy storage of logs with metrics;
Slow data aggregation;
It is necessary to manually change configurations or redefine (embed) to work with the database/cache/external services.
Also, do not forget about “hidden” calls to external storage: various libraries for integrations (s3, oauth2.0), which go to external systems and which should also be monitored. For example, we also have monitoring for accessing the oauth2 data server (and the request is also proxied with a double retray) – we only had to inherit a couple of base library classes and add data logging.
All the minuses, except for the last one, can be leveled by switching to another repository or a ready-made APM implementation.
There are pluses:
Everything works on the current installed software; You don’t need to install anything new.
When studying user problems (especially complaints about a long response time), you can immediately, without departing from the business logic logs, check the execution timings of various kinds of requests;
For example, often we had problems with a slow API precisely because of long calls to external services. By installing an nginx proxy in front of these services, we have reduced network overhead.During development, you can immediately evaluate the complexity of the created service from the container logs – you can see how many times it went to the database, to the cache, how many queries it executed and which of them were heavier than the others;