DDoS attacks and BGP incidents in Q3 2021
The third quarter of 2021 was in many ways a record in terms of the scale and intensity of DDoS attacks.
The climax of events occurred in September, when we, together with Yandex, discovered and reported to the public about one of the most destructive botnets since Mirai, calling it Meris, as it was responsible for a series of attacks with high requests per second. And while attackers were targeting different targets around the world, our quarterly statistics also changed somewhat.
In addition, this time we have prepared for your attention a fragment of statistics on attacks at the application level (L7).
Without unnecessary praises, let’s take a closer look at the statistics on DDoS attacks and BGP incidents for the third quarter of 2021.
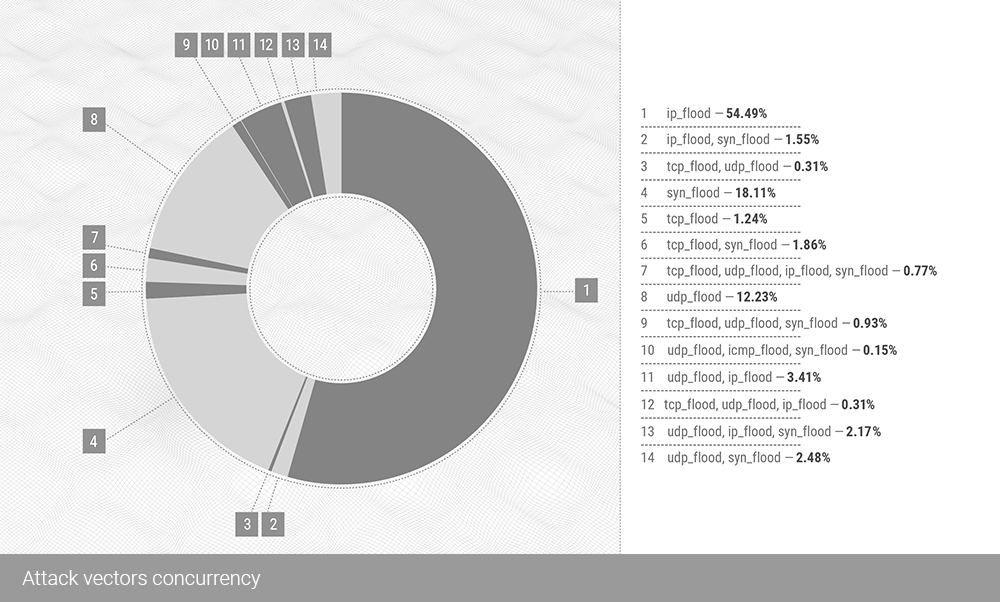
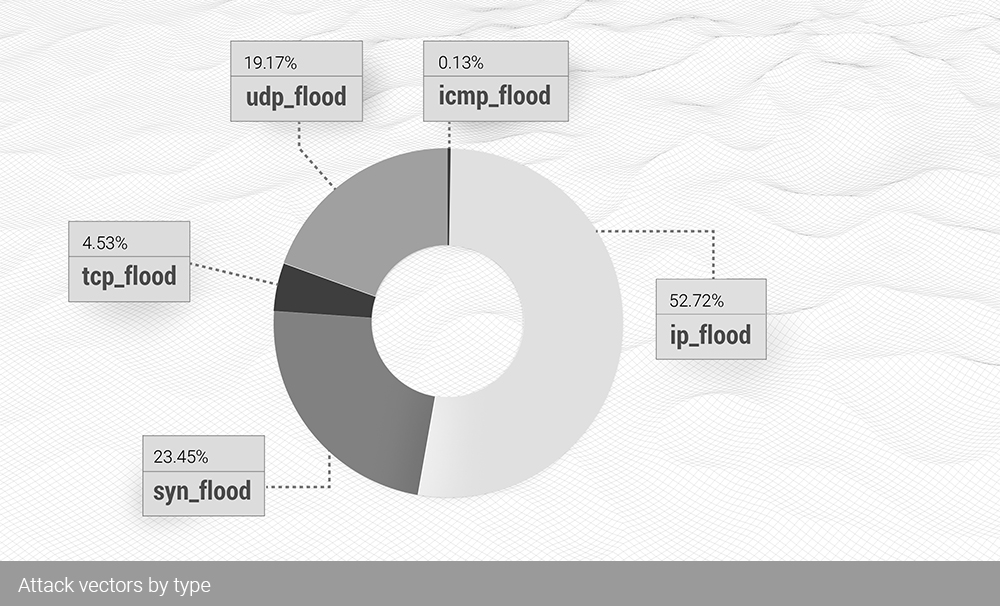
The top three main vectors for DDoS attacks in Q3 include:
IP flood with 54.59% of all attacks;
SYN flood with 18.11%;
And UDP flood from 12.21%.
This section underwent a statistical reversal as IP fragment floods swapped places with UDP floods, the vector responsible for most attacks in Q2 2021, accounting for 53.10% in Q2. In the last quarter, almost the same number – 54.49% – already refers to IP flood. Below we will tell you in more detail why.
At the end of the third quarter, these three vectors together accounted for 84.83% of all L3 attacks.
The largest concurrent combination, UDP flood mixed with IP flood, accounted for only 3.41% of the total, down from 6.6% in Q2 2021.

In the third quarter, the median attack duration dropped to 150 seconds from 270 seconds in the second quarter. The same happened with the average duration, which dropped to 554.67 seconds in the third quarter, from 1970 seconds in the second.
Such a significant reduction in the duration of attacks is probably due to the start of the business season, which can also be called the season of attacks.
With the continued growth of bandwidth and burst intensity, the “suppression fire” tactics of DDoS attackers reflect the realities of this “business.” If the victim doesn’t go offline quickly and easily, it’s easier to move on to other targets. The median attack time of 2.5 minutes is the lowest ever recorded.
As we mentioned earlier, the change in location between IP fragment floods and UDP floods in Q3 versus Q2 was highly anticipated. Moreover, we expect this trend to continue in the future.
The reason is that as attackers try to improve the overall effectiveness of attacking devices, larger targets are chosen to amplify (amplify) the effect, such as DNS records, and it is fairly standard that these blocks of data significantly exceed the MTU limit. Thus, fragmentation becomes inevitable.
Until now, the number and “quality” of DDoS attacks has been steadily growing throughout more than 25 years since the first SYN flood. The number of devices is also constantly growing, which means that amplified DDoS attacks will always remain a viable method for organizing them. This leads us to the conclusion that L3 attacks will continue to drift towards flooding with IP fragments.

Comparing the duration of individual attack vectors for the third quarter with the data for the second, it becomes obvious that the leader has changed here too. But in this case, it is not an IP flood, but a SYN flood, which now has the longest duration among all attacks on L3. The average duration is over 14 minutes and the median is 3 minutes. Conversely, for the IP flood, which, as we wrote earlier, was the most visible attack vector in Q3, the duration values are the smallest, with an average IP flood duration of just under 6 minutes and a median duration of 2.5 minutes. Although the median for TCP flood is even shorter (90 seconds), all other percentiles are lower for IP flood.
The maximum attack duration also falls into the SYN flood category, with an attack lasting more than six hours.

In terms of throughput for DDoS attacks, the situation has also changed quarter (3) after quarter (2), but not so dramatically. The SYN flood still has the lowest bitrate of any L3 vectors, as it did in Q2, with an average of 320 Mbps in the third quarter, compared to an average of 514 Mbps in the second quarter.
While in Q2 the highest average bitrate came from flood of IP fragments, in Q3 UDP flood dominated the bit rate statistics with an average of 9.3 Gbps. The median TCP flood throughput (916.53 Mbps) is still roughly half the median UDP flood of 1.91 Gbps.
Of course, we also wanted to capture the further development of the average throughput across all attacks in the quarter. Recall that in the second quarter of 2021, the average bit rate of all attacks neutralized by us was 6.5 Gbps.
In the third quarter of 2021, the average throughput of all DDoS attacks we neutralized was 4.31 Gbps. This number is very close to the Q4 2020 average bit rate of 4.47 Gbps, but significantly lower than Q1 2021’s 9.15 Gbps.

In Q3 2021, TCP flood finally took first place in packet intensity statistics with the highest average (4.03 Mpps), median (1.09 Mpps), and maximum (33.94 Mpps) values. The minimum packet rate of a TCP flood is almost twice as high as that of the next vector, a SYN flood, and 4 times as high as for an IP flood.

The three-hop section of our report also shows significant changes. First of all, there is a sharp shift in attacks to territories with a lower bitrate: 77.22% of all attacks occur in the interval from 1 to 10 Gbps. Most of them moved into a smaller interval from the next, from 10 to 100 Gbps, which lost 15.47% of attacks in the third quarter, compared to the second.
However, the most dangerous segment of 100+ Gbps attacks received an additional percentage of the mass, accounting for 4.44% of the total number of DDoS attacks in the third quarter of 2021.

If we look at the industries that have been hit by the attacks of the third quarter, the shift in targets becomes apparent. In the second quarter of 2021, the most significant attacks targeted e-commerce, but in the third quarter of 2021, we had two main categories of neutralized DDoS attacks: banks (22.28%) and payment systems (28.69%). E-commerce attacks fell from 19.97% in the second quarter to 11.54% in the third.
But the banking sector, which attracted 18.47% more attacks in the third quarter than the second, and the payment systems sector, where the number of attacks grew by 21.88% during the same period, were under real pressure.
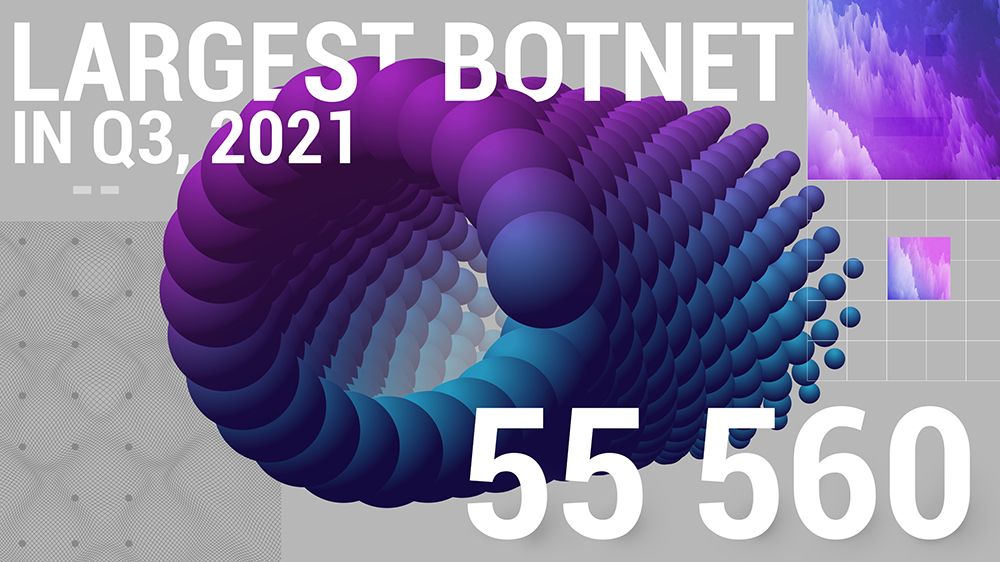
The largest botnet recorded, apart from Mēris, in the third quarter of 2021 had 55,560 devices.

Let’s be honest with you, dear reader, this is our first public attempt to classify application layer (L7) DDoS attacks. Therefore, please do not judge strictly.
As you can see from the graph, the largest category is the violation of HTTP semantics. By “violation” we mean various deviations from the usual and expected behavior of the user of the protected resource.
Request Rate Patterns will include anything different from what we expect from a legitimate user in terms of request rate, similar to the previous category.
These two categories differ from the third, called anomalous URL navigation, which means exactly what the name implies – an action that a legitimate user is often unable to perform.
Together, these three main categories are responsible for 71.51% of all attacks at the application layer (L7), and another 12.93% in the multiple match group, where we put all parallel L7 attack vectors.

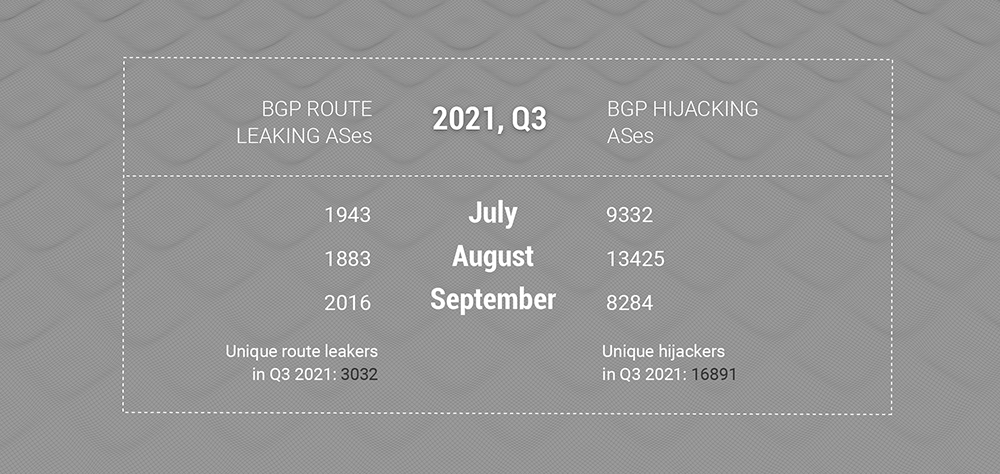
As always, there are a lot of BGP route leaks and BGP address space hijackings in the world. In particular, the number of intercepting autonomous systems did not decrease in the third quarter as well as historically in general, even taking into account a slight drop in July and September, and before that in April.
In 2021, the first quarter was the only one in which the number of unique interceptors of address space in BGP was slightly lower compared to the rest of the past part of the year.

Significant changes can be seen in the number of BGP hijackings of the address space. In the third quarter, we recorded probably the lowest number of interceptions in a long time of keeping records: “only” 4 357 906 separate incidents, which is about 35% less than the values of the first and second quarters.
Hijacking of address space in BGP has always been the lesser evil, between them and route leaks, and it was easier to tame them with the implementation of RPKI and ROA. It is good to see that the number of hijacks has dropped slightly and we will confirm in the future if it was seasonal or perhaps this is paying off MANRS’s efforts to train network operators and internet companies.
But again, the number of unique autonomous systems performing address space interceptions remains about the same as usual.
Now let’s take a look at the global incidents that are part of these statistics for each month within the quarter. Reminder: The Qrator.Radar command has a set of defined thresholds that separate global incidents from all others. These include the number of prefixes, autonomous systems affected, and the extent to which the anomaly is distributed across the routing tables.
Global BGP Route Leaks:
July: 3
August: 1
September: 2
Detailed descriptions of these incidents can be found by date in the Twitter feed Qrator.Radar…
Global Traffic Interceptions with BGP:
July: 0
August: 0
September: 1
Thank you for the attention.