David O’Brien (Xirus): Metrics! Metrics! Metrics! Part 2
David teaches individuals and companies everything related to Microsoft Azure and Azure DevOps (formerly VSTS) and is still engaged in practical consulting and infra-coding. He has been the winner of the Microsoft MVP (Microsoft Most Valuable Professional) Award for 5 years, and recently received the MVP Azure Award. As co-organizer of the Melbourne Microsoft Cloud and Datacentre Meetup, O’Brien regularly speaks at international conferences, combining his interest in traveling the world with a passion for sharing IT stories with the community. David’s blog is located at david-obrien.netHe also publishes his online Pluralsight trainings.
The presentation talks about the importance of metrics for understanding what is happening in your environment and how your application works. Microsoft Azure has a powerful and easy way to display metrics for all kinds of workloads, and the lecture tells how you can use them all.
At 3 a.m., Sunday, during sleep, you suddenly wake up with a text message: “The supercritical application is not responding again”. What is going on? Where and what is the cause of the “brakes”? In this talk, you will learn about the services that Microsoft Azure offers customers to collect logs and, in particular, metrics for your cloud workloads. David will tell you which metrics should interest you when working on a cloud platform and how to get to them. You will learn about open source tools and building dashboards, and as a result, you will gain enough knowledge to create your own dashboards.
And if at 3 o’clock in the morning the message about the crash of the critical application wakes you up again, you can quickly figure out its cause.
David O’Brien (Xirus): Metrics! Metrics! Metrics! Part 1
Since the slides would be too bulky, I preferred the demo. Consider how you can visualize monitoring, and start with the Monitor-Metrics tab. As I mentioned, this is easy enough. All you need to do is specify the resource used in the Resource group drop-down menu and the resource type in the Resource type menu. In our case, I select all 72 types of metrics.

Fortunately or unfortunately, most cloud services run on virtual machines, and I do the same. On this virtual machine, by default, Microsoft shows us host metrics. In particular, we can see the amount of traffic passing through this VM over the past 24 hours with a measurement interval of 15 minutes. You see, we have got a wonderful dashboard for this metric. This is not a very advanced metric, and we can do nothing with it, except to view the amount of outgoing traffic in megabytes. Of the tools here are: the ability to add a new rule regarding restrictions and the ability to attach this metric to the dashboard.
Those who use the virtual machine should know what Telegraf is, which is indicated on the RESORCE line. This is an open source TING plugin written in Go, which is designed to collect metrics or data from the system on which it is installed. Telegraf passes the collected metrics to the InfluxDB database. This cross-platform plugin works on Windows and Linux.

As I said, by default, Microsoft Azure Monitor uses hypervisor metrics for the virtual machine, this is indicated on the METRIC NAMESPACE line. Similar happens in AWS. I can’t say anything about the GSP cloud platform, as I have never used it. So, I choose Telegraf as the resource and instruct him to transfer this metric to the Sum monitor.

I can go to the METRIC list and select more metrics displayed. For example, now I select the usage_steal metric (use interception). Does anyone know what it is?
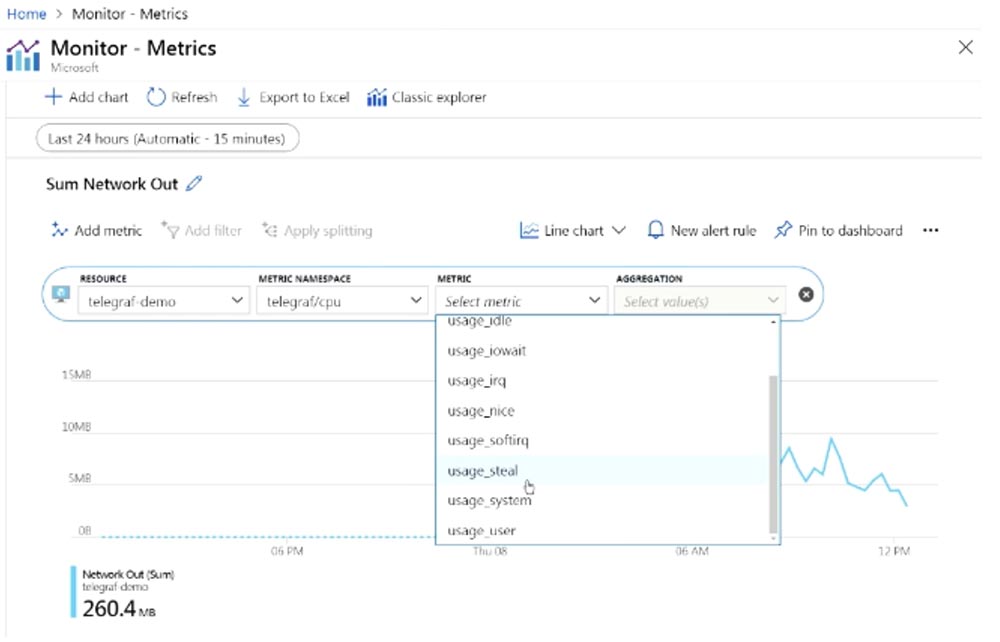
How many of you live in an apartment with neighbors who like to listen to music very loudly? Okay, so usage_steal is a metric that shows how your cloud neighbors can affect your operating system. Many people forget that they run their applications in a public cloud environment. In both GCP, AWS, and Azure, providers put you on a shared infrastructure. You share your infrastructure – virtual machine, applications, APIs – with other users. This does not mean that they have access to your data, but they can affect your applications, and you should be aware of this. If you don’t know about this effect, then your application may have some difficulties in working. If you do not collect usage_steal metrics, you will not know that your application may be affected by extraneous impact. Suppose you run your program, everything works fine, without errors, but suddenly something happens, and the application crashes. This happens quite often and depends on what type of virtual machine you are using, and how many VMs of the same type your provider places on each host. It is likely that your programs will be adversely affected by this infrastructure.
The only way to prevent this from happening is in two ways: the first is to wait until everything goes by itself, and the second is to deploy your virtual machine on the host of another hypervisor. However, to make a decision, you must be aware of this by collecting the appropriate metrics. As you can see, when using the usage_steal metric, the monitor does not show any activity, probably because I did not run a large number of applications.
So, we can create our own dashboard by placing monitors of selected metrics on it. This panel can be shared with other users, and I usually advise my clients to create panels like this, placing them on a large screen in the office so that they are visible to all employees.

Every morning, coming to work, anyone can look at such a screen and find out what is happening with the system. For example, you can see that 500 HTTP connection errors have been fixed and not wait for the clients to inform you about this, but figure out the reason for their occurrence and fix the problem with your site.
More advanced monitoring is collecting percentiles. For example, knowing the average performance of your CPU may not be enough, because different applications load the processor differently.
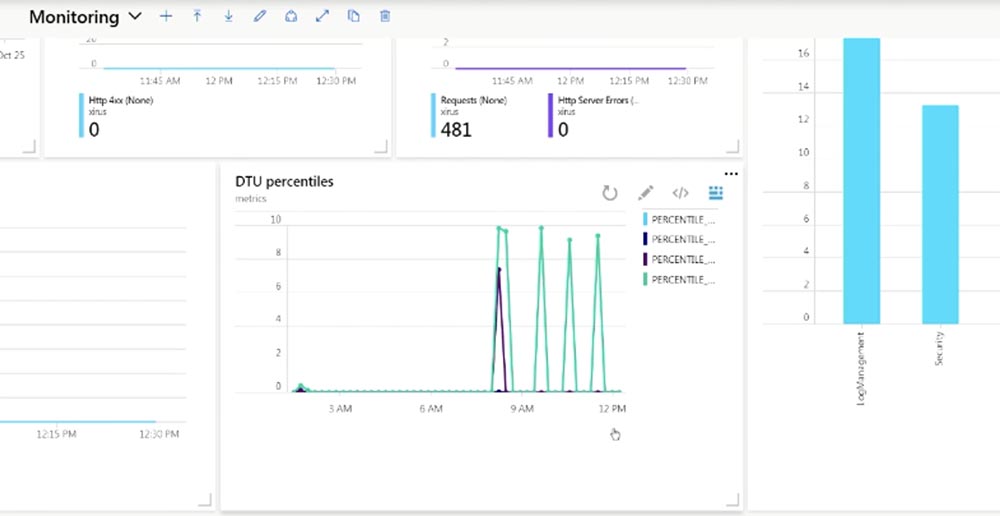
Percentiles give you an understanding of what is happening globally. Suppose 99 percentiles is 200 ms. This means that 99% of all your requests have a response time of up to 200 ms, and this also means that 1% of your customers receive a response with a delay exceeding 200 ms.
Depending on the content of your SLA, remember what we talked about at the beginning, you should consider this fact. In fact, most often you pay attention to the average value, instead of taking into account percentiles. And the average value “hides” such deviations in itself.
Consider how we get these values. The fact is that Azure Monitor does not calculate anything. You can get the average value, maximum or minimum, but if you need more advanced metrics obtained as a result of calculations, you should use log analysis. Log analytics uses the KQL language, this is a very useful feature of Azure “out of the box.”

If you look at this metric, you can see that the resource provider is Microsoft.SQL, it itself is called “dtu_consumption_percent” and is engaged in the creation of percentiles. This may not be particularly applicable to your workflows, but you should know that the Log Analytics module provides this capability. So you can use analytics if you need more advanced calculations of your metrics. True, you have to pay for it. By default, this tool allows you to process up to 5 GB of data per month for free, however, I know clients who use 5 GB per minute. So 5 GB per month might not be enough.
On the screen you see a metric showing that I am currently using 20 MB. Since this is a demo environment, the amount of data obtained is very small. As I said, right out of the box, Logs Analytic allows you to process up to 5 GB of data per month for free, storing it for 41 days. It is necessary to pay for exceeding these volumes, but in my experience, this service is still cheaper than similar third-party products, such as Splunk or Sumo.
Let’s move on to Grafana, which has a plugin for Azure Monitor. It was released a few weeks ago in version 0.2. Thanks to this plugin, you can use Grafana for your metrics. I prefer to deploy Grafana on App Services, as it is possible to use containers here. This allows me to run applications on a laptop. To do this, I run this command line:

after which I can quickly test something or show something to my clients.
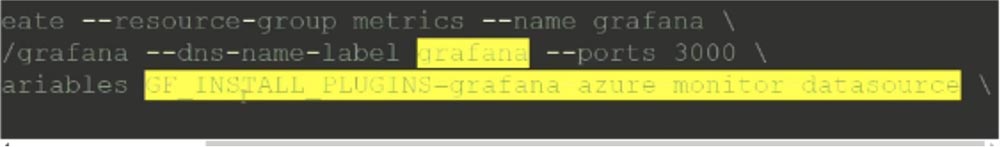
Deploying Grafana in an Azure environment also takes one line, I just split it into 4 so that I can see it on one screen.
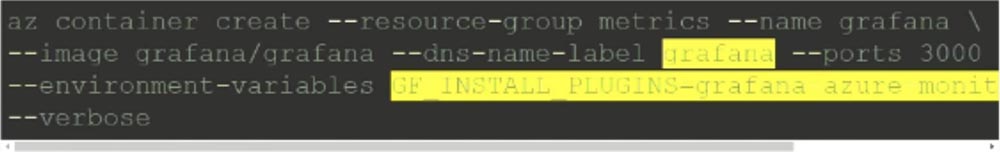
There are so-called “container structures” in Azure, such as AWS, the equivalent of similar Google structures. This is one container image that can be distributed across multiple containers. The team I highlighted launches Grafana at the same time as Azure Monitor. Deploying Grafana in a monitor environment takes approximately 30 seconds.
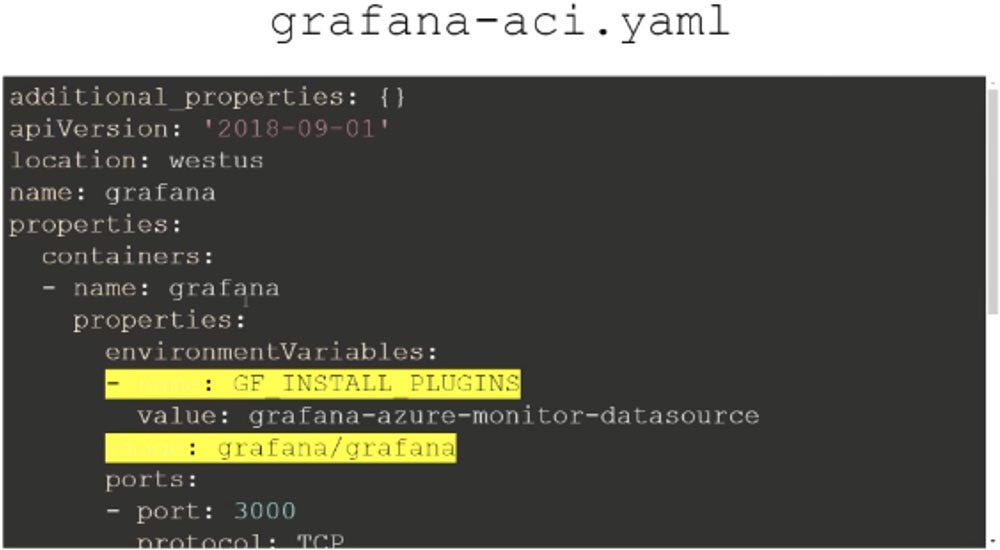
I can do the same through the infrastructure code:

Details can be seen on my Twitter, later I will give my contacts. A file with the extension .yaml indicates how to use the container image and what you need to do with it. There are a lot of lines of code here, and I need to scroll down the window so that you can see it. This file is deployed by Grafana on the Azure platform.

So, I go to Grafana on my laptop and show the dashboard that I created. One thing that I still cannot do is to pass Telegraf metrics to Grafana. Unfortunately, these useful metrics that run in a virtual machine are not yet displayed in Grafana. Microsoft is solving this problem, and we will probably see the result in new versions of Telegraf and Grafana. For now, we can use the hypervisor metrics that Telegraf offers by default in the drop-down menu of the Metric line. On the virtual machine, it is possible to create various custom metrics that Grafana lacks, and then paste them into this application. This can be done if the custom metric can be placed in the Azure metric suite.

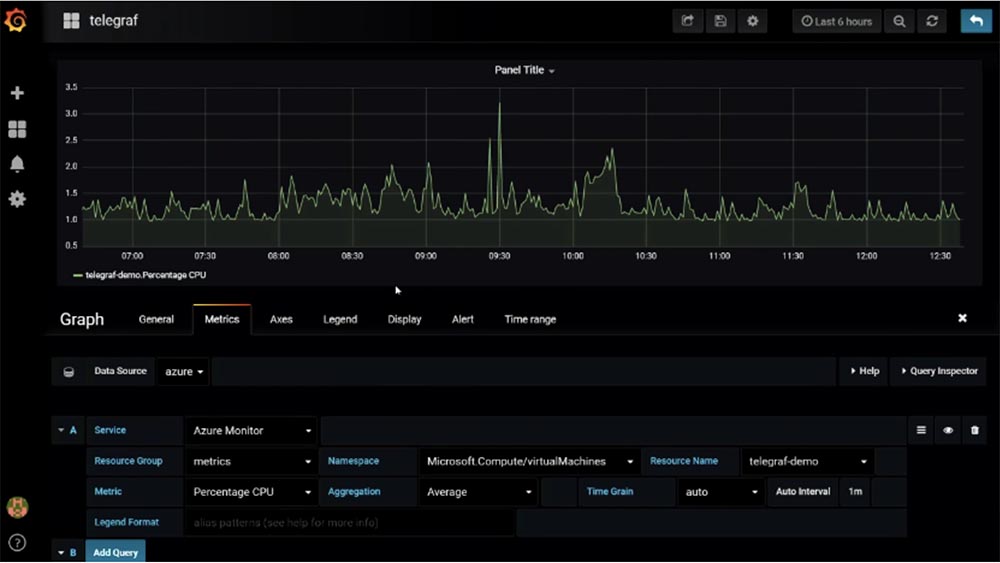
Customers often ask me what should they use? Grafana visually displays the metrics of various processes, and Azure allows you to perform more complex metric calculations. In the latter case, you get a large set of metrics “out of the box,” but Azure only displays Azure metrics. Thus, the choice depends on the tasks you perform. You can create metrics for your site, for databases, for deployable applications, integrate them into Grafana and create one voluminous informative panel. Unfortunately, you will not be able to do this with Azure, and I do not think that Microsoft intends to extend the functionality of Azure to such an extent.
However, I recommend that you start creating your dashboard specifically with Azure, because today, working with a small number of applications, you can already work with Azure metrics, which is better than doing nothing at all.
So, our acquaintance with Azure Monitor metrics is nearing the end, and I want to tell about myself. My name is David O’Brien, and my Microsoft MVP status means that I spend a lot of time talking about Azure and teaching me how to use this service.

I have my own company, we organize training courses around the world, talking about various Microsoft products, including cloud services. You see my contacts on Twitter, where I am super active by blogging. You do not need to photograph this slide, just remember the address of the Xirus website. You can ask your questions!
Question: Metrics are very important, but what do you say about log management?
Answer: in principle, managing logs in Azure is similar to managing metrics. You can also place them in your repository, then send them to Log Analytics and then use this application to process logs in the same way as metrics. You can collect the logs and store them outside the machine, place them in containers and then centrally place them in the right place.
Question: can this be done automatically or programmatically?
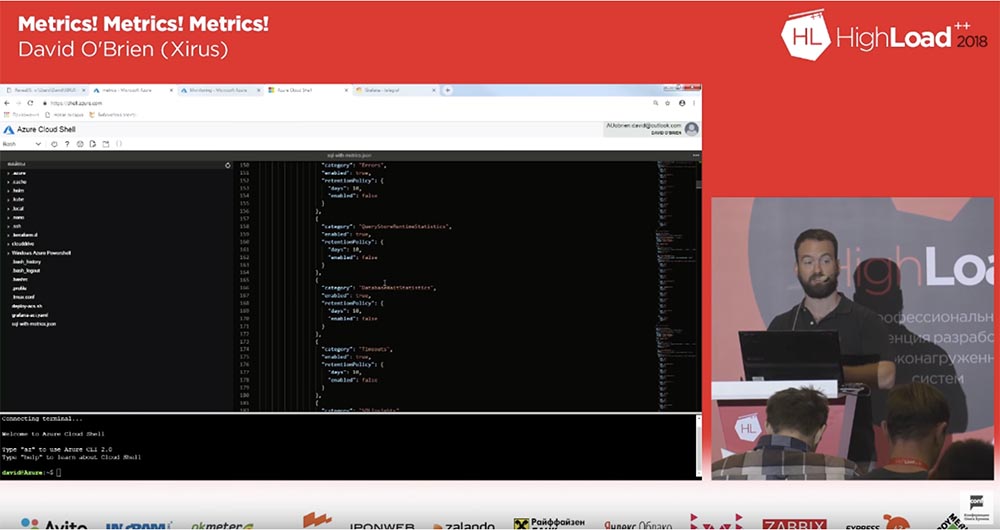
Answer: in any way. Let’s get back to the Azure Cloud Shell – you see that here in the metrics section there is a service that can present metrics as logs. For example, I can create an error template and tell this service: “please post these logs here.” During this demonstration, I showed you simple options for working with Azure, but in real life conditions, please use these templates. You can use this method through the CLI command line interface or in any other convenient way. If you do not want to write templates and JSON, you can use the open engine to write HTTL templates, Microsoft allows this.
No more questions? Thank you for spending this time with me!