David O’Brien (Xirus): Metrics! Metrics! Metrics! Part 1
David teaches individuals and companies everything related to Microsoft Azure and Azure DevOps (formerly VSTS) and is still engaged in practical consulting and infra-coding. He has been the winner of the Microsoft MVP (Microsoft Most Valuable Professional) Award for 5 years, and recently received the MVP Azure Award. As co-organizer of the Melbourne Microsoft Cloud and Datacentre Meetup, O’Brien regularly speaks at international conferences, combining his interest in traveling the world with a passion for sharing IT stories with the community. David’s blog is located at david-obrien.netHe also publishes his online Pluralsight trainings.
The presentation talks about the importance of metrics for understanding what is happening in your environment and how your application works. Microsoft Azure has a powerful and easy way to display metrics for all kinds of workloads, and the lecture tells how you can use them all.
At 3 a.m., Sunday, during sleep, you suddenly wake up with a text message: “The supercritical application is not responding again”. What is going on? Where and what is the cause of the “brakes”? In this talk, you will learn about the services that Microsoft Azure offers customers to collect logs and, in particular, metrics for your cloud workloads. David will tell you which metrics should interest you when working on a cloud platform and how to get to them. You will learn about open source tools and building dashboards, and as a result, you will gain enough knowledge to create your own dashboards.
And if at 3 o’clock in the morning the message about the crash of the critical application wakes you up again, you can quickly figure out its cause.
Good afternoon, today we will talk about metrics. My name is David O’Brien, I am the co-founder and owner of the small Australian consulting company Xirus. Thank you again for coming here to spend your time with me. So why are we here? To talk about metrics, or rather, I will tell you about them, and before you do any things, we start with a theory.
I’ll tell you what metrics are, what you can do with them, what you need to pay attention to, how to collect and enable the collection of metrics in Azure, and what visualization of metrics is. I will show you what these things look like in the Microsoft cloud and how to work with this cloud.
Before starting, I will ask you to raise the hands of those who use Microsoft Azure. And who works with AWS? I see a few. What about Google? ALI Cloud? One man! Fine. So what are metrics? The official definition of the US National Institute of Standards and Technology looks like this: “A metric is a measurement standard that describes the conditions and rules for measuring a property and serves to understand the measurement results.” What does it mean?
For example, consider the metric for changing the free space of a virtual machine disk. For example, we are given the number 90, and this number means percentages, that is, the amount of free disk space is 90%. I note that it is not very interesting to read the description of the definition of metrics, which occupies 40 pages in pdf format.
However, the metric does not say how the measurement result was obtained, it only shows this result. What do we do with metrics?
First, measure the value of something, then use the result of the measurement.

For example, we learned the amount of free disk space and now we can use it, use this memory, etc. After we get the result of the metric, we must interpret it. For example, the metric gave a result of 90. We need to know what this number means: the amount of free space or the amount of disk space used in percent or gigabytes, network latency equal to 90 ms, and so on, that is, we need to interpret the meaning of the metric value. In order for metrics to make sense at all, after interpreting a single metric value, we need to ensure the collection of multiple values. This is very important because many people are not aware of the need to collect metrics. Microsoft has made it very easy to get metrics, but you must ensure that they are collected. These metrics are stored for only 41 days and disappear on the 42nd day. Therefore, depending on the properties of your external or internal equipment, you should take care how to save metrics for more than 41 days – in the form of logs, magazines, etc. Thus, after the collection, you should place them in some place that allows you to raise, if necessary, all statistics of changes in the results of metrics. By placing them there, you can begin to work effectively with them.
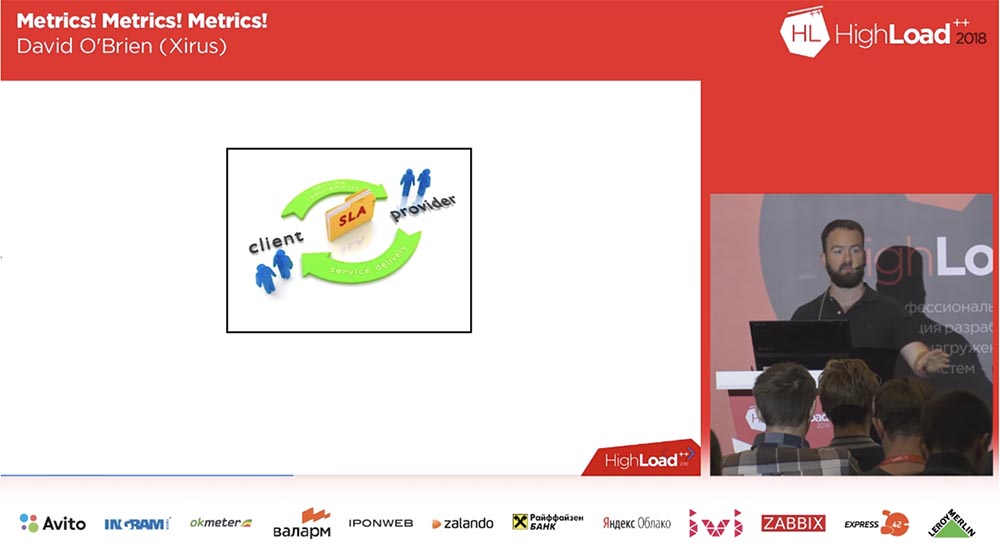
Only after you receive the metric values, interpret them and collect them, you can create an SLA – an agreement on the level of service. This SLA may not be of particular importance to your customers, it is more important for your colleagues, managers, those who provide the system and are concerned about its functionality. The metric can measure the number of tickets – for example, you get 5 tickets per day, and in this case it shows the speed of response to user requests and the speed of troubleshooting. A metric should not just report that your site loads in 20 ms or a response speed of 20 ms, a metric is more than just one technical indicator.
Therefore, the goal of our conversation is to present you a detailed picture of the essence of metrics. The metric serves to look at it and you can get a complete picture of the process.
As soon as we get the metric, we can guarantee 99% of the working state of the system, because this is not just a look at the log file, which says that the system is working. A guarantee of 99% availability means that, for example, in 99% of cases, the API responds with a normal speed of 30 ms. This is exactly what interests your users, your colleagues and managers. Many of our clients track the logs of web servers, while they do not notice any errors in them and think that everything is in order. For example, they see a network speed indicator of 200 mb / s and think: “ok, everything is fine!”. But in order to achieve these 200, users need a response speed of 30 milliseconds, and this is exactly the indicator that is not measured and is not collected in the log files. At the same time, users are surprised that the site loads very slowly, because without the necessary metrics, they don’t know the reasons for this behavior.
But since we have a SLA that guarantees 100% uptime, customers begin to express indignation, because in reality the site is very difficult to use. Therefore, to create an objective SLA, you need to see a complete picture of the process created by the collected metrics. This is the subject of my ongoing debate with some providers who, when creating the SLA, do not understand what the term “uptime” means, and in most cases do not explain to their customers how their API works.
If you created a service, for example, an API for a third person, you should understand what the received metric 39.5 means – answer, successful answer, response at a speed of 20 ms or at a speed of 5 ms. You must adapt their SLAs to your own SLAs, to your own metrics.
Having figured out all this, you can begin to create a smart dashboard. Tell me, has anyone already used Grafana’s interactive visualization app? Fine! I am a big fan of this open source, because this thing is free and easy to use.

If you have not used Grafana, I will tell you how to work with it. Who was born in the 80-90s, probably remembers the caring CareBears cubs? I don’t know how popular these bears were in Russia, but in terms of metrics we should be the same “caring bears”. As I said, you need a detailed picture of the entire system, and it should not concern only your API, your website or service running on a virtual machine.

You must organize the collection of those metrics that most fully reflect the operation of the entire system. Most of you are software developers, so your life is constantly changing, adapting to the new requirements of the product, and just as you are concerned about coding processes, you should take care of metrics. You need to know how the metric touches every line of code you write. For example, next week you start a new marketing company and expect a large number of users to visit your site. To analyze this event, you will need metrics, and perhaps you will need a whole panel to track the activity of these people. You will need metrics to figure out how successful and how your marketing company actually works. They will help you, for example, to develop an effective CRM – customer relationship management system.
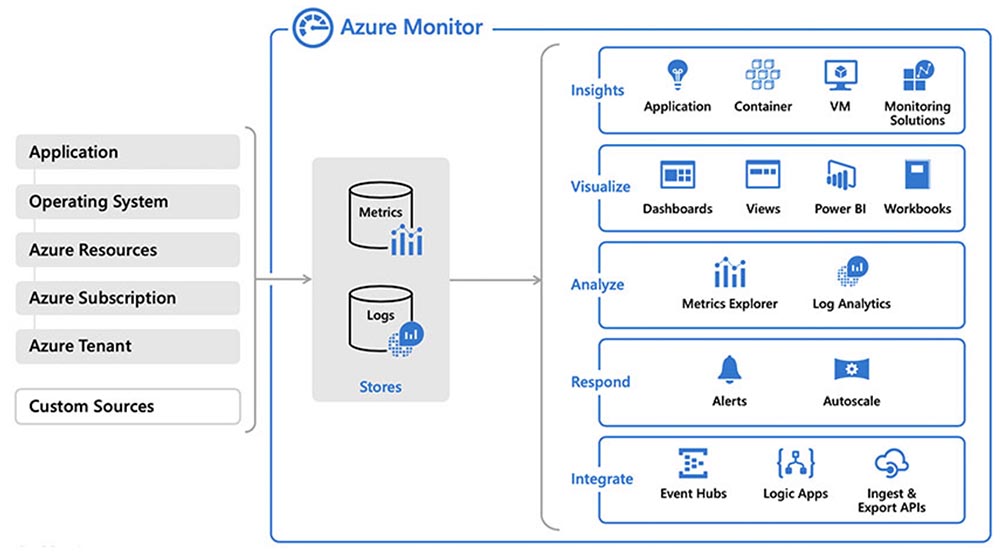
So let’s get started with our Azure cloud service. It is very easy to find and organize the collection of metrics in it, because it has Azure Monitor. This monitor centralizes the configuration management of your system. Each of the Azure elements you want to apply on your system has many default metrics enabled. This is a free application that works directly “out of the box” and does not require any preliminary settings, you do not need to write anything and “screw” it to your system. We will verify this by viewing the following demo.

In addition, it is possible to send these metrics to third-party applications, such as Splunk log storage and analysis system, SumoLogic cloud-based log management application, ELK log processing tool, IBM Radar. True, there are small differences that depend on the resources you use – a virtual machine, network services, Azure SQL databases, that is, the use of metrics differs depending on the functions of your work environment. I will not say that these differences are serious, but, unfortunately, they are still present, and this should be taken into account. Inclusion and transfer of metrics is possible in several ways: through Portal, CLI / Power Shell or using ARM templates.
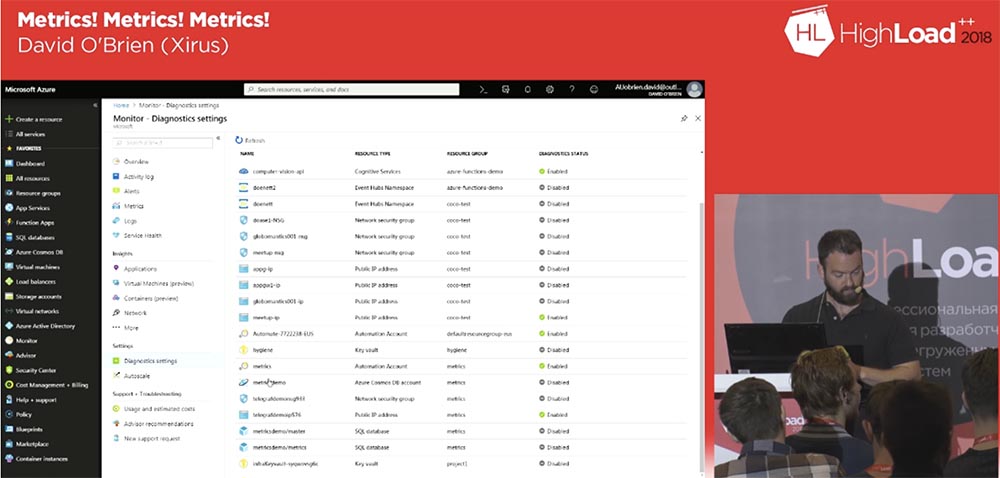
Before embarking on the first demonstration, I will answer your questions. If there are no questions, let’s get started. The screen shows what the Azure Monitor page looks like. Can any of you say that this monitor is not working?
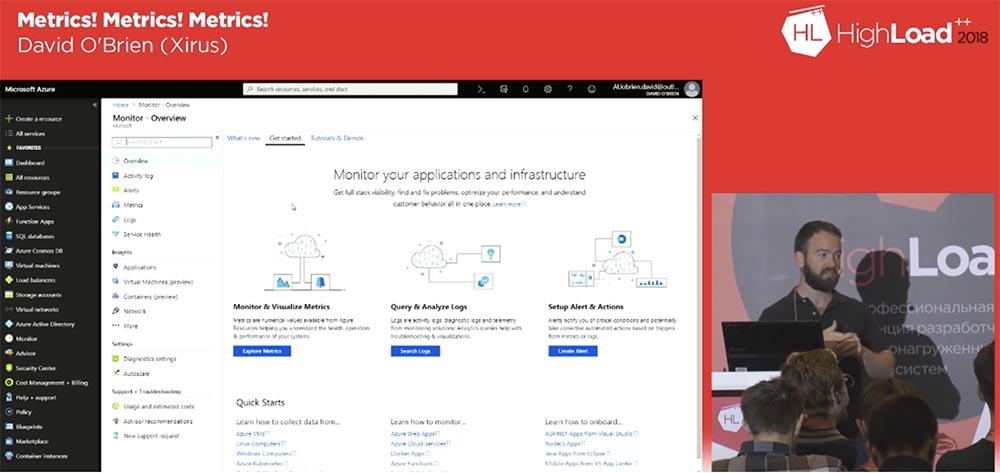
So, now everything is in order, you see how the monitor services look. I can say that this is a great and very simple tool for everyday work. With it, you can monitor applications, networks and infrastructure. Recently, the monitoring interface has been improved, and if earlier the services were located in different places, now all the information on the services is consolidated on the monitor home page.
The metrics table is a tab along the Home Monitor Metrics path that you can go to to see all available metrics and select the necessary ones. But if you need to enable metrics collection, you need to use the Home Monitor Diagnostic settings directory path and check the Enabled / Disabled metrics checkboxes. By default, almost all metrics are in the enabled state, but if you need to enable something additional, then you will need to change the diagnostic status from Disabled to Enabled.
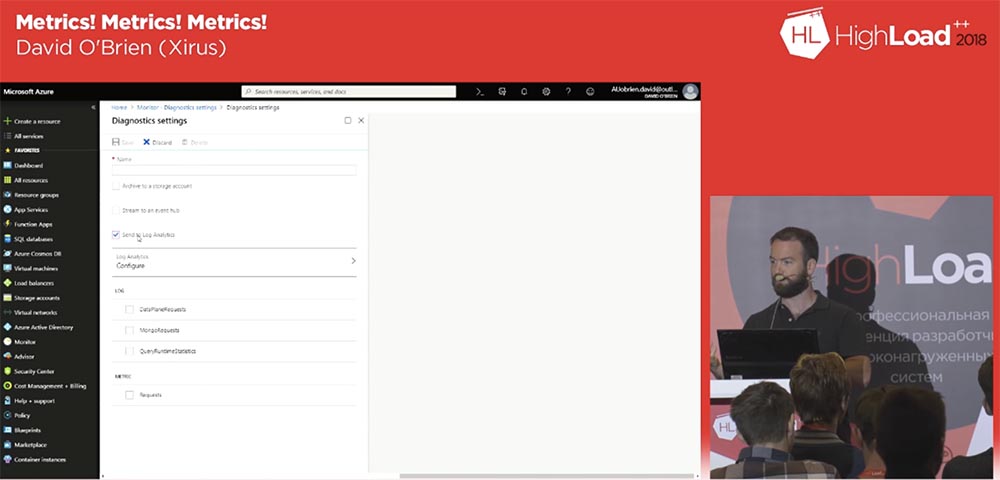
To do this, click on the row of the selected metric and on the tab that opens enable diagnostic mode. If you are going to analyze the selected metric, then after clicking on the Turn on diagnostic link, check the Send to Log Analytics checkbox in the window that appears.
Log Analytics is a bit like Splunk, but cheaper. This service allows you to collect all your metrics, logs and everything you need, and place them in the Log Analytics workspace. The service uses a special KQL query processing language – Kusto Quarry Language, we will consider its work in the next demo. For now, I’ll note that with its help you can formulate queries regarding metrics, logs, terms, trends, patterns, etc. and create dashboards.
So, we mark the Send to Log Analytics checkbox and the LOG panel checkboxes: DataPlaneRequests, MongoRequests and QueryRuntimeStatistics, and below on the METRIC panel – the Requests checkbox. Then we assign a name and save the settings. On the command line, this is two lines of code. By the way, the Azure Cloud shell in this sense resembles Google, which also allows you to use the command line in your web browser. AWS has nothing of the kind, so Azure is much more convenient in that sense.
For example, I can run the demo through the web interface without using any code on my laptop. To do this, I must authenticate using my Azure account. Then you can use, for example, terrafone, if you already use it, wait for the connection to the service and get the Linux working environment, which Microsoft uses by default.

Next, I use the Bash built into the Azure Cloud Shell. A very useful thing is the IDE built into the browser, a lightweight version of VS Code. Next, I can go into my error metric template, change it and customize it to my needs.
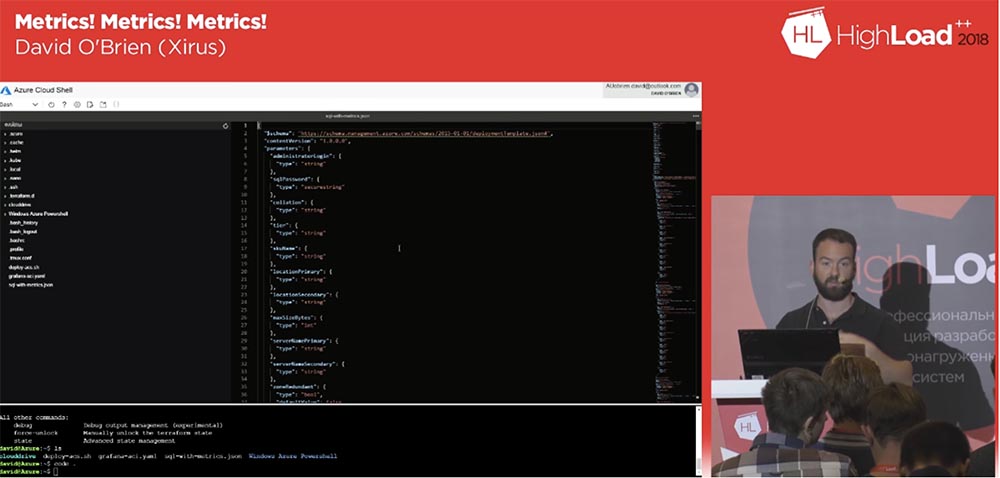
By setting up metrics collection in this template, you can use it to create metrics for your entire infrastructure. After we apply the metrics, collect and save them, we will need to visualize them.
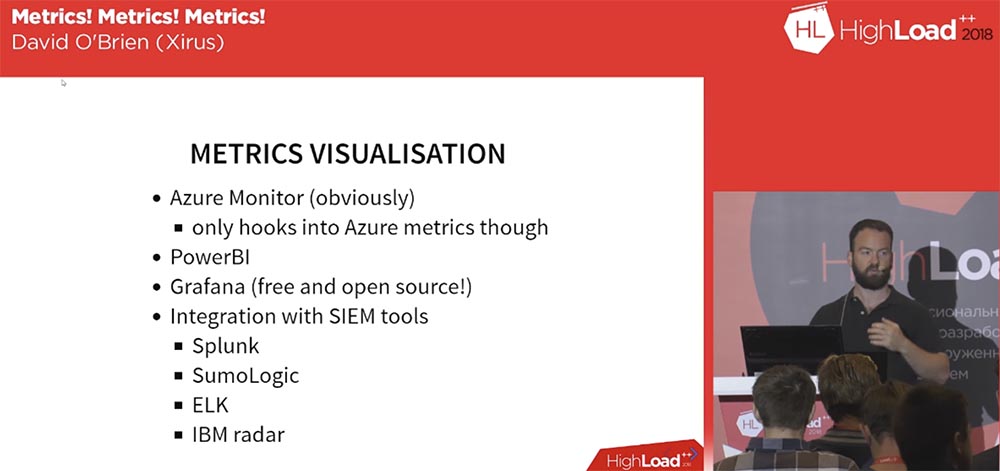
Azure Monitor only deals with metrics and does not provide an opportunity to get an overall picture of the state of your system. You may use a number of other applications that are running outside of Azure. So if you need to monitor all processes, visualizing all the collected metrics in one place, then Azure Monitor will not work for this.
To solve this problem, Microsoft offers the Power BI tool – a comprehensive software for business analysis, which includes visualization of a wide variety of data. This is a rather expensive product, the cost of which depends on the set of functions you need. By default, it offers you 48 types of processed data and is associated with Azure SQL Data Warehouses, Azure Data Lake Storage, Azure Machine Learning Services and Azure Databricks. Using scalability, you can receive new data every 30 minutes. This may be enough for your needs or not enough if you need real-time monitoring visualization. In this case, it is recommended to use applications such as the one mentioned by me Grafana. In addition, the Microsoft documentation describes the ability to send metrics, logs, and event tables using SIEM tools to the visualization systems Splunk, SumoLogic, ELK, and IBM radar.
23:40 min
The sequel will be very soon …