Data Science “on the fingers.” Statistics is the science of changing your view of things in the face of uncertainty

What is statistics? Some kind of obsolete way to wallow in data. Yeah. 100% technically correct definition. Now let’s see what statistics are as a discipline.
Statistics is the science of how to change your mind.
Making decisions based on facts (parameters) is already quite difficult, but – damn it! – sometimes we don’t even have the facts we need. Instead, what we know (sampling) is different from what we would like to know (totality). This is what it means to fall into uncertainty.
Statistics is the science of how to change your decisions in the face of uncertainty. How can you think? Choose default actions or follow the path of a priori beliefs. But what if you have a blank sheet in your head? Read it better.
Bayesians change their mind about perceptions.
Bayesian statistics is a school of thought that uses data to update your mind. Bayesians prefer to report the results using a confidence interval (two numbers that are interpreted as “I believe the answer is somewhere between this and this”).
Adherents of frequency statistics change their mind about actions.
Frequency statistics use data to change your mind about actions. You do not need to have any submissions to complete the default actions. This is basically what you will do if you do not analyze the data. Frequency (it’s also classical) is statistics that you often encounter in nature, so let’s give it the name of the classic until the end of this article.
Hypotheses are descriptions of how the world might look.
The null hypothesis describes all worlds where a choice in favor of the default action will have a successful outcome; an alternative hypothesis describes all other worlds. If I can convince you – using the data! – that you live in a world of not null hypotheses, then you better change your mind and take alternative actions.
For example: “We can go to class together (default action), if you usually need less than 15 minutes to prepare (null hypothesis), but if evidence (data) suggests that you need more time (alternative hypothesis), you can go alone because I went (alternative action). ”
Quick check: “My evidence turns the null hypothesis into absurdity?”
The whole hypothesis test comes down to the question: do my proofs make the null hypothesis ridiculous? The rejection of the null hypothesis means that we have learned something and must change our minds. Not a refutation means that we did not learn anything interesting. It’s like being in a forest, not meeting people there and concluding that there are no more people on the planet. It just means that we did not learn anything interesting about the existence of people. Are you sad that we didn’t learn anything? This should not be, because you have an excellent insurance policy: you know exactly what actions to take. If you have not learned anything, you have no reason to change your mind – continue to follow the default steps.
So, how do we understand that we learned something interesting … something that is not appropriate for the world in which we want to continue to perform our actions by default? To get an answer, we can take a look at the p-value or at a reliable interval.
The p-value in the periodic table is an element of surprise.
The P-value says: “If I live in a world in which I have to take such and such an action by default, how surprising are my proofs?” The lower the p-value, the more data shout: “Wow, this is amazing! Maybe you should change your mind! ”
To pass the test, compare the p-value with a threshold called the significance level. This is a lever with which you can adjust the amount of risk. The maximum probability is to foolishly leave a cozy, heated place in the form of a default action. If you set the significance level to 0, then you do not want to make a mistake and unjustifiably refuse the default action. Turn the lever down! Do not analyze the data, just follow the default steps. (But it may also mean that you end up stupidly NOT giving up on the bad default action.)
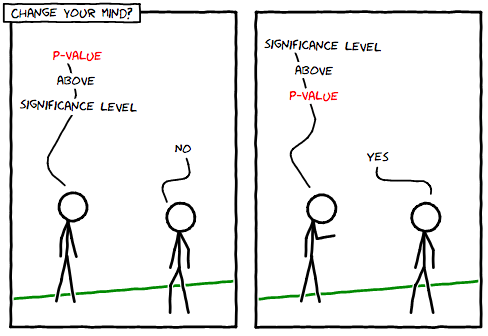
How to use p-values to find out the result of a hypothesis test. (No one will suspect that my xkcd is fake)
A valid interval is just a way to find out the results of a hypothesis test. To use it, check if it matches your null hypothesis. If yes, it matches, then there is nothing to recognize. If not, make another decision.
Only change your opinion if the reliable interval does not coincide with your null hypothesis.
Although the technical meaning of the term “reliable interval” is a bit strange (I will tell you more about it in the next post, it is definitely not as simple as the confidence interval that we met earlier), it also has two useful properties that analysts like to use when describing of their data: (1) there is always a better guess and (2) with the advent of the data, the interval becomes narrower. Beware, neither the interval nor the p-value was created not to talk about them was pleasant, so do not expect meaningful definitions. This is just a way to summarize test results. (If you went to classes and couldn’t remember the definition, then here’s why. On behalf of statistics: it’s not you, it’s all me).
What’s the point of this? If you conduct testing in the way I just described, mathematics ensures that your risk of making a mistake is limited by the level of significance you choose (which is why it is important that you, um, choose it … mathematics and exists to guarantee your risk parameters , and it will be a little pointless if you do not bother to choose them anyway).
Mathematics is the construction of a toy model of the universe of null hypotheses. So you get the p-value.
Math is all about creating and exploring toy universes (how cool it is, yes, comrades obsessed with megalomania ?! Very cool!) To check how likely datasets like yours are to occur. If your toy model of the universe of the null hypothesis is unlikely to provide data similar to those you received from the real world, then your p-value will be low, and in the end you will reject the null hypothesis … you need to change your mind!
Why all these crazy formulas, probabilities and distributions? Thanks to them, we state the rules governing the universe of the null hypothesis. We can find out if this universe is a place that produces data similar to what you received in real life. If not, then you shout: “Funny! Head off the shoulders!” And if so, then just shrug your shoulders and get nothing new. I will discuss this in more detail in the next post. In the meantime, just think about mathematics as a tool for creating small toy worlds so that we can see if our data set looks reasonable in them. P-value and valid interval are ways to summarize all this information for, so you don’t need to squint at the verbose description of the universe. There is a denouement here: use them to check if it is worth following the default actions. And the work is done!
Have we done our homework? Here are the power measures.
Wait a minute, and we did our homework to make sure that we really gathered enough evidence to get an honest opportunity to change our minds? This is the concept of power in statistics. It is very easy not to find any evidence-altering evidence … just not look for it. The higher the power, the more opportunities to change your mind, in case this is correct. Power is the probability of a correct rejection of the default action.
When we do not learn anything new and continue to do what we did, then, having great power, it becomes easier for us to relate to our process. At least we did our homework. If we had no power whatsoever, we would know that there is no need to change our minds. You might as well not bother with data analysis.
Use power analysis to check if you have enough data before starting.
Power analysis is a way to check how much power you expect to receive for a given amount of data. You use it to plan your research before you begin. (It’s pretty simple; in the next post I will show you that it actually takes only a few cycles.)
Uncertainty means that you can come to the wrong conclusion, even if you have the best math in the world.
What is not in statistics? Magical magic that can turn uncertainty into certainty. There is no magic that could do this; you can still make a mistake. Speaking of errors, here are two errors that you can make in frequency statistics. (Bayesians are not mistaken. Just kidding! Well, sort of.)
Type I error is to refuse stupidly the default action. Hey, you said that it was convenient for you to follow the default action, and now, after all your calculations, have abandoned it. Oh! Type II error – stupidly do not abandon the default actions. (We statisticians are extremely inventive in coming up with names. Guess which mistake is worse. Type I? Yeah. Very creative.)
Type I error – to change opinions when it should not.
Type II error – do not change opinions when it should.
Type I error is similar to the conviction of the innocent, and type II error is the inability to convict the guilty. These are equilibrium probable errors (which simplifies the trial of the guilty, also simplifies it and the innocent), unless you have more evidence (data!), Then the probability of making a mistake becomes lower, and things are getting better. That’s why statisticians want you to have a LOT, REALLY LOT of data! Everything goes well when you have a lot of data.
The more data, the lower the probability of reaching the wrong conclusion.
What is multiple hypothesis testing? You must conduct testing in a different, corrected way if you intend to ask several questions of the same data set. If you continue to put the innocent suspects on trial again and again (probing the soil of your data), in the end, by chance, someone will be guilty. The term statistical significance does not mean that something important has happened within the universe. It just means that we have changed our minds. Perhaps on the wrong. Damn this uncertainty!
Do not waste time diligently answering the wrong questions. Use statistics wisely (and only if necessary).
What is type III error? This is a kind of statistical joke: it refers to the correct rejection of the incorrect null hypothesis. In other words, using the right math to answer the wrong question.
The cure for asking the wrong questions and the wrong answers can be found by looking at Decision Intelligence. This is a new discipline that deals with data science and applies it to solve business problems and find the right solutions. With decision intelligence, you will increase your immunity to Type III errors and worthless analytics.
So to summarize: statistics are the science of how to change your mind. There are two schools of thought. The most popular – frequency statistics – checks whether to abandon the default action. Bayesian statistics deals with a priori opinion and its modernization with the help of new data. If you have a blank sheet in your head, before you start, take a look at the data and just listen to your intuition.

Learn the details of how to get a sought-after profession from scratch or Level Up in skills and salary by taking paid SkillFactory online courses:
- Machine Learning Course (12 weeks)
- “Data Scientist Profession” Course (24 months)
- Profession Data Analyst Course (18 months)
- Python for Web Development Course (9 months)
Read more
- The coolest Data Scientist does not waste time on statistics
- How to Become a Data Scientist Without Online Courses
- Sorting cheat sheet for Data Science
- Data Science for the Humanities: What is Data
- Steroid Data Scenario: Introducing Decision Intelligence