Create an interactive report in Power BI using Buttons, Bookmarks, and the Selection Pane
Introduction
Sometimes the tools that “lie on the surface” are not enough to build a functional and interactive report. At such moments, you need to dig a little deeper, show a little imagination and ingenuity.
In this article, I want to talk about how using Buttons, Bookmarks, and Selection Pane, you can make your report more functional without overloading it with unnecessary elements.
A bit of theory
Buttons Is what makes your report interactive and functions like an application. The main types of buttons are: Back, Bookmark, Drill through, Page navigation, Q&A, Web URL.
In more detail with the principles of creating buttons, you can read the link…
Bookmarks allow you to fix the current state of the report page. You can use bookmarks to save filters and slicers, cross-selected visuals, sort order, and more. When viewing a report, users can revert to a specific state by selecting a saved bookmark.
Selection Pane allows you to manage the visibility state of each object added to the report page, as well as group objects, change the order of their display.
Description of the task
Suppose you have sales data for a store in the United States for 2015-2018. (you can download the data file by the link). You need to develop a report that will allow you to analyze 4 main indicators – Sales, Profit, Profit Ratio and Average Discount Rate – in the context of several categories, for example, by region, state and product category.
The math is simple: 4 metrics * 3 categories = 12 visual elements. Probably, this is still too much for one report.
The solution to this problem can be as follows: provide the user with the ability to choose which of the 4 metrics he wants to analyze in the context of the categories noted above, and in addition add several filters that will hide so as not to overload the report and appear when the corresponding buttons are pressed.
The solution to be described in the article
Download pbix file ButtonsAndBookmarksReport you can follow the link…
Brief description of the report


-
A button that allows you to show the filter panel.
-
Report title.
-
Block “Factoids”, which displays the actual values of indicators for the selected period of time (in this case for 2017), their comparison with the previous period (vs 2016), as well as their dynamics. Each subblock of indicators is also a button that allows you to choose which statistics to view in terms of parameters from block 4.
-
Visualization of the indicator selected in block 3 by subcategories, regions and states.
-
A button that allows you to hide the filter panel.
-
Filters panel.
Let’s start developing
Let’s rebuild the upper block of “Factoids”.
Each sub-block consists of the following elements:

-
Text element.
-
The actual value of the indicator. Visualization type – Card.
-
Change in indicator vs previous period. Visualization type – Card. The formula for calculating the measure:
VS PY Sales =
VAR PreviousSales =
    CALCULATE(
        SUM(Orders[Sales]),
        SAMEPERIODLASTYEAR(Orders[Order Date].[Date])
    )
RETURN
    ROUND(
        DIVIDE(
            SUM(Orders[Sales]) - PreviousSales,
            PreviousSales
        ) * 100 ,
    2)
    & "% vs. PY"
4.Dynamics of the indicator. Visualization type – Area Chart with removed labels and X, Y axes.
At the top of these elements, which I advise to group for ease of further use, there are two buttons that “hide” in turn, depending on whether the indicator is selected or not. The green-bordered button is displayed if the parameter is selected, the gray-bordered button is displayed if the parameter is not selected.
You can customize the order in which items are displayed as follows:

1. On the toolbar, go to the Format tab.
2. In the Bring forward settings, choose where you want to transfer the selected element: to the bottom layer (Bring forward) or to the top layer (Bring to front).
Let’s start adding the rest of the visualizations, which, depending on the buttons pressed on the Factoids panel, will display statistics for different metrics.
1) In order to be able to dynamically substitute either one metric or another as a measure, you need to create a table with a list of metrics using Enter Data.

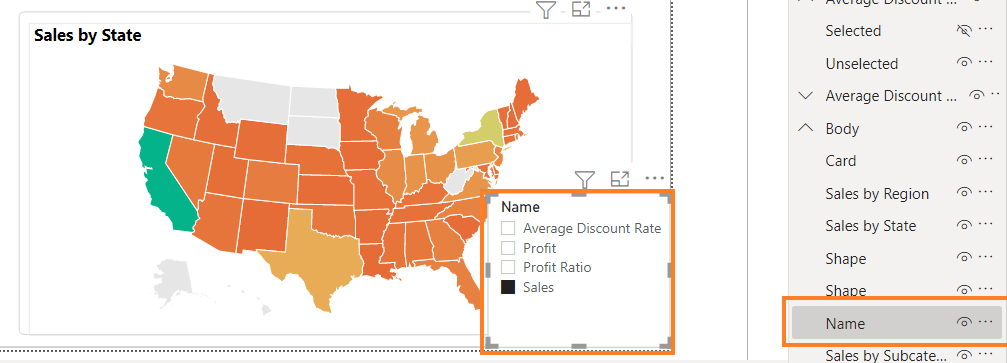
2) Add a slicer to the report page based on the Name field from the above table.
3) Create a Metric Selected measure that will dynamically calculate either the Sales amount, or the Profit amount, or Profit Ratio, or Average Discount Rate, depending on what is selected in the Name slicer.
Metric Selected =
    SWITCH(
        SELECTEDVALUE('Metric Name'[ID], 1),
        1, SUM(Orders[Sales]),
        2, SUM(Orders[Profit]),
        3, [Profit Ratio],
        4, AVERAGE(Orders[Discount])
    )
* assumes that Profit Ratio metrics – is a measure that has already been calculated using the formula SUM (Orders[Profit]) / SUM (Orders[Sales])…
4) Create 3 visualizations: a bar chart of the distribution of Metric Selected by subcategories, a bar chart of the distribution of Metric Selected by region, a map of the distribution of Metric Selected by state.
5) Create measures to be used for dynamic titles.
Custom Subcategory Title =
SELECTEDVALUE('Metric Name'[Name])
& " by Subcategory"
Custom Region Title =
SELECTEDVALUE('Metric Name'[Name])
& " by Region"
Custom Map Title =
SELECTEDVALUE('Metric Name'[Name])
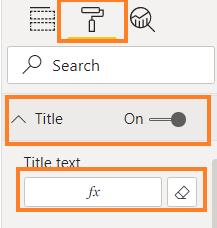
& " by State"6) Set up a dynamic title based on the measures created in step 5. Format -> Title -> fx…
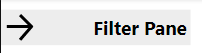
7) Create a button “Filter Pane” with an arrow to the right (this button will open the filter panel)
8) Create a filter panel, which consists of a semi-transparent rectangle, a “Filter Pane” button with a left arrow (this button will close the filter panel), and 6 slicers: Year, Segment, Customer Name, Category, Product Name, Ship Mode.

After all the elements are added to the report page, the process of creating bookmarks and setting up buttons with the Bookmark type begins.
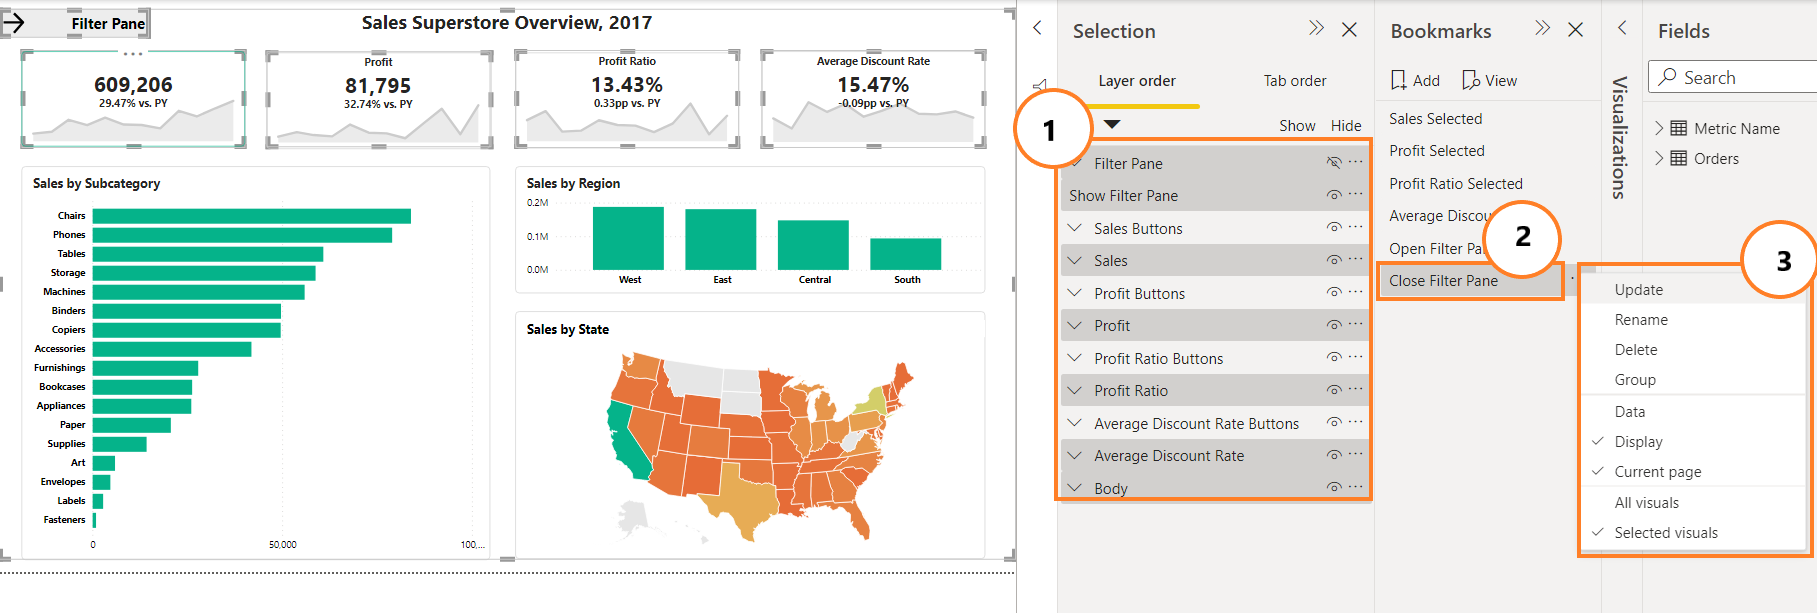
Step 1. First, you need to display the tab bar and the object control panel on the report page.


As you can see, my object control panel already contains all the elements I created earlier.
Advice: group elements that are logically related to each other for the convenience of their further use. In order to group elements, select everything you need, right-click and select Group.

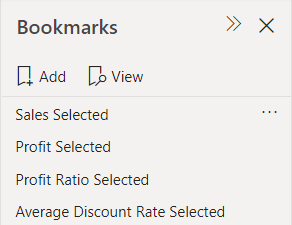
Step 2. Let’s create the first 4 tabs, which will allow us to fix the selection in the “Name” slicer: Sales Selected, Profit Selected, Profit Ratio Selected, Average Discount Rate Selected.
Step 3. Let’s set up the Sales Selected tab.
-
Hide the button with a gray border for the Sales block and leave the button with a green border (this will be a hint to the user that this metric has been selected to be displayed on charts by category).
-
Hide the buttons with a green border for the Profit, Profit Ratio and Average Discount Rate blocks, and display the buttons with a gray border for them (since at the moment another metric is selected – Sales – and these metrics are available for selection).

* Buttons are grouped for each block: the button with a green border is named Selected, with a gray one – Unselected.
-
Also hide the Filter Pane.
-
After the Filter Pane grouping is hidden, the Unselected button for Sales, the Selected buttons for Profit, Profit Ration and Average Discount Rate, the Name slicer with Sales selected, do the following:
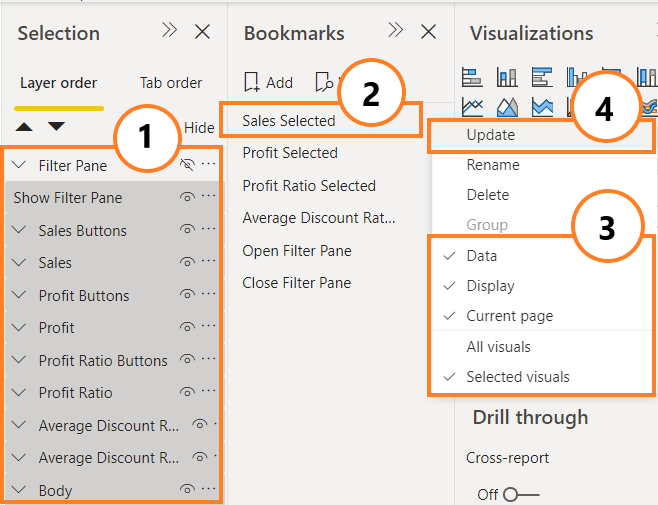
1. In the Selection panel, select using Shift all the elements, except for the Filter Pane (do not select the filter panel so that pressing the button to select an indicator does NOT affect the display of the filter panel).
2. On the Bookmarks panel, left-click on the desired bookmark, in our case it is Sales Selected.
3. In the window that appears, check that the Data settings are selected (this setting allows you to save the selected Sales indicator in the Name slicer and fix this selection to the current bookmark) and Selected Visuals (the setting allows you to apply the bookmark only to those items that are selected in the Selection panel, i.e. everyone except the Filter Pane).
4. Click Update to save all the settings selected for the current bookmark.
Step 4. In the same way, it is necessary to configure the buttons for the remaining indicators: Profit, Profit Ration and Average Discount Rate, choosing the corresponding metric in the Name slicer in turn.
Step 5. After setting up the tabs for each indicator, you need to “assign” them to the corresponding buttons. For each button with a gray border (indicating the ability to select this indicator), we do the following:
-
Select the button with a gray border (now we are on the Sales Selected tab, i.e. the button with a gray outline for Sales is hidden for us, and for the green button no action is provided, since the indicator Sales is already selected, so let’s start setting from the button for the Profit indicator).
-
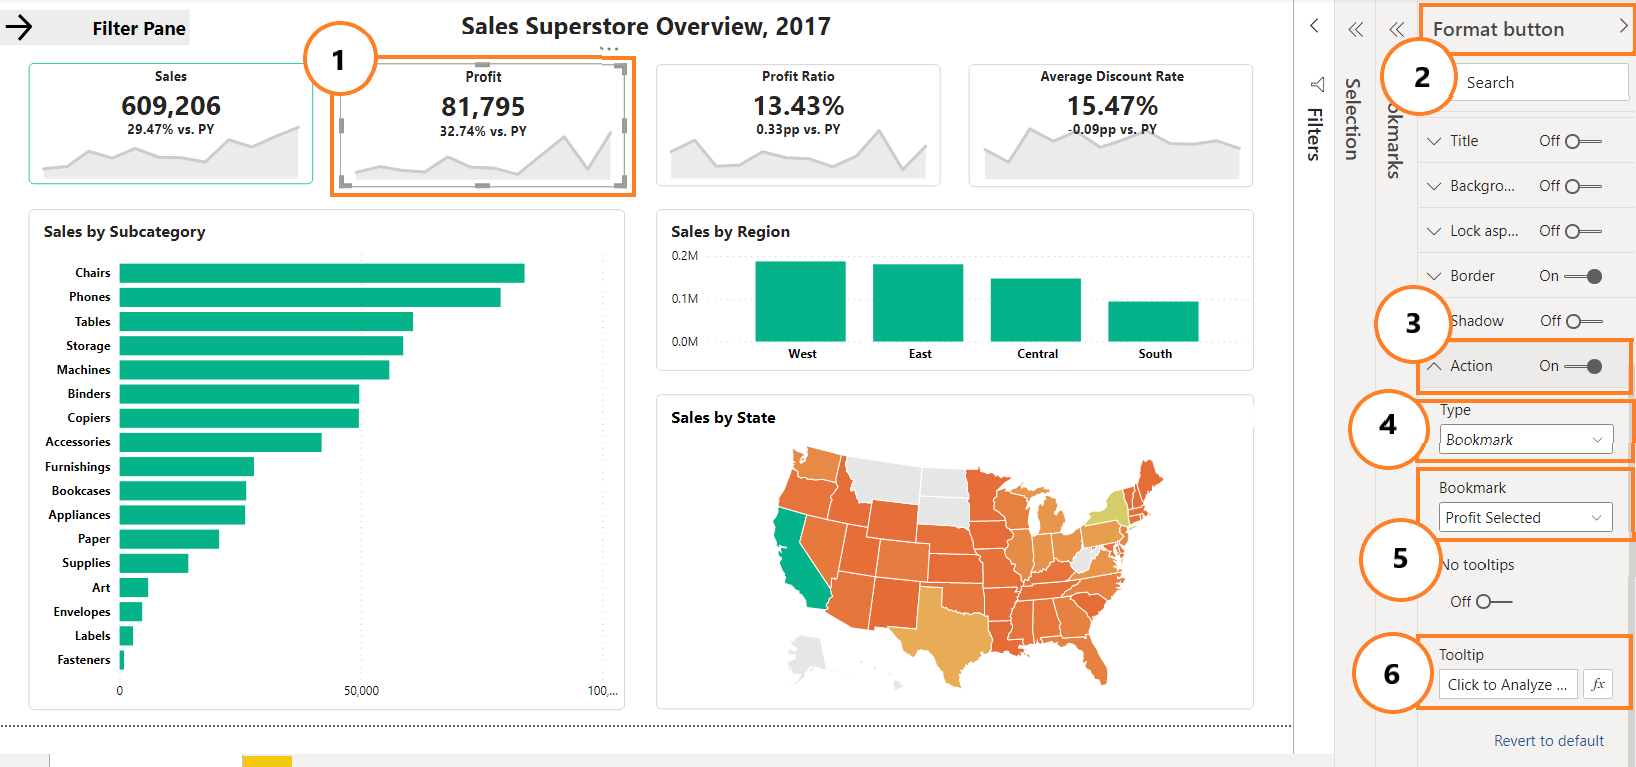
Go to the button formatting panel.
-
Go to the Action section and turn it ON.
-
Select the Bookmarks button type.
-
Select the desired bookmark with which you want to associate this button. In this case, it is Profit Selected.
-
Set up a tooltip for this button: on hover, a pop-up window with the text “Click to Analyze by Profit” will be displayed.
Step 6. Do the same for the remaining buttons. clue: To customize the button for the measure Sales, navigate to the tab for any other measure.
Step 7. After configuring the buttons for selecting an indicator, we will configure the buttons for opening and closing the filter panel. Now the filter panel is hidden, so we can fix the current display of the elements and assign it to the Close Filter Pane button in the future. But first, let’s create a bookmark called Close Filter Pane and customize it:
-
In the Selection panel, check that the Filter Pane grouping is hidden. Next, we select all the elements, except for the indicator selection buttons (since we do not want the choice of this tab to affect which metric is displayed, because other tabs are responsible for this).
-
Right-click on the Close Filter Pane tab. In the window that appears, uncheck the box opposite the Date setting (we do not want this tab to fix any values of any slicers, this tab will simply hide the filter panel), select the Selected Visuals setting (i.e. apply the bookmark only to those elements , which are highlighted in the Selection panel: to all except Sales Buttons, Profit Buttons, Profit Ratio Buttons, Average Discount Buttons).
-
Click Update to save the selected settings.
Step 8. Next, set up the Open filter Pane tab by opening the filters panel and hiding the button to open this panel.

-
In the Selection panel, hide the Show Filter Pane button and display the Filter Pane grouping, then select all the elements, except for the indicator selection buttons.
-
Right-click on the Open Filter Pane tab. In the window that appears, uncheck the box next to the Date setting, select the Selected Visuals setting.
-
Click Update to save the selected settings.
Step 9. Let’s assign the button for opening the filter panel to the Open Filter Pane tab, and the button for closing the filter panel – Close Filter Pane. Let’s set up the appropriate tooltips for each button: Click to Open Filter Pane, Click to Close Filter Pane.
After the main development is completed, let’s set up the display format of the buttons.
In order for the buttons to look different depending on whether they are in the default state, or they are hovered over with the mouse, it is necessary to turn to the button formatting panel.
In my example, the default button is transparent, and on hover it turns transparent green.
-
Select the button you want to format.
-
Go to the formatting panel.
-
In the Fill category, select the Default state and configure this button state as follows:
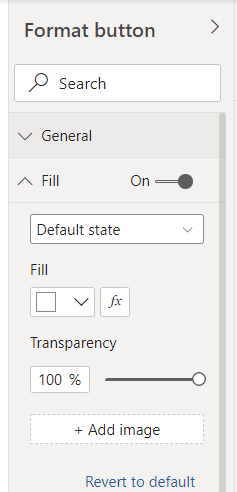
-
For the On hover state:

Next, we test all the steps implemented above.
Even more useful information
Join the telegram channel Informed By Data, there you will find a lot of useful information about data analytics, visualization and intelligent data manipulation.