Centralized Docker Logging Using ELK Stack
As part of the launch practical intensive ELK prepared a translation of useful material for you. We also invite everyone interested to online meeting with an intensive teacher, where the teacher will talk about the program, the format of training and prospects for graduates.
As your infrastructure grows, having robots and a reliable centralized logging system becomes critical. Centralizing logging becomes a key aspect of many IT tasks and gives you a good overview of your entire system.
The best solution is to aggregate metadata logs from all containers. This will provide you with the best tracking options and the opportunity to get good support from the community. This is where ELK Stack comes in. ELK, also known as Elastic stack, is a combination of modern open source tools like ElasticSearch, Logstash and Kibana. It is a complete end-to-end log analysis solution that you can use on your system.
Each component has a specific role to play: ElasticSearch is the best way to store raw logs, Logstash helps you collect and convert logs into a consistent format, and Kibana adds a great level of visualization and helps you manage your system in a user-friendly manner.
In this tutorial, you will learn how to deploy ELK and set up container log aggregation. We are going to combine ELK with Filebeat, to aggregate container logs. For this we are going to create our own Docker image.
Step 1 – Configuring Filebeat
Let’s start by setting up Filebeat. First, to build the image, you need to create a Dockerfile:
$ mkdir filebeat_docker && cd $_
$ touch Dockerfile && nano Dockerfile
Now open the Dockerfile in a text editor of your choice and copy / paste the following lines:
FROM docker.elastic.co/beats/filebeat:7.5.1

COPY filebeat.yml /usr/share/filebeat/filebeat.yml
USER root
RUN mkdir /usr/share/filebeat/dockerlogs
RUN chown -R root /usr/share/filebeat/
RUN chmod -R go-w /usr/share/filebeat/
In the filebeat_docker directory, create a filebeat.yml file containing the configuration for Filebeat. In this tutorial, we will detail the filebeat.yml file to a minimum.
filebeat.inputs:
  - type: docker
    containers:
      path: "/usr/share/dockerlogs/data"
      stream: "stdout"
      ids:
        - "*"
      cri.parse_flags: true
      combine_partial: true
      exclude_files: ['.gz$']

processors:
  - add_docker_metadata:
      host: "unix:///var/run/docker.sock"

filebeat.config.modules:
  path: ${path.config}/modules.d/*.yml
  reload.enabled: false

output.logstash:
  hosts: ["127.0.0.1:5044"]

log files:
logging.level: error
logging.to_files: false
logging.to_syslog: false
loggins.metrice.enabled: false
logging.files:
  path: /var/log/filebeat
  name: filebeat
  keepfiles: 7
  permissions: 0644
ssl.verification_mode: none
Now let’s create a Filebeat Docker image:
$ docker build -t filebeatimage .
Sending build context to Docker daemon  3.584kB
Step 1/6 : FROM docker.elastic.co/beats/filebeat:7.5.1
7.5.1: Pulling from beats/filebeat
c808caf183b6: Already exists
a07383b84bc8: Pull complete
a3c8dd4531b4: Pull complete
5547f4a87d0c: Pull complete
d68e041d92cd: Pull complete
7cfb3f76a272: Pull complete
748d7fe7bf07: Pull complete
Digest: sha256:68d87ae7e7bb99832187f8ed5931cd253d7a6fd816a4bf6a077519c8553074e4
Status: Downloaded newer image for docker.elastic.co/beats/filebeat:7.5.1
 ---> 00c5b17745d1
Step 2/6 : COPY filebeat.yml /usr/share/filebeat/filebeat.yml
 ---> f6b75829d8d6
Step 3/6 : USER root
 ---> Running in 262c41d7ce58
Removing intermediate container 262c41d7ce58
 ---> 1ffcda8f39cf
Step 4/6 : RUN mkdir /usr/share/filebeat/dockerlogs
 ---> Running in 8612b1895ac7
Removing intermediate container 8612b1895ac7
 ---> 483d29e65dc7
Step 5/6 : RUN chown -R root /usr/share/filebeat/
 ---> Running in 4a6ad8b22705
Removing intermediate container 4a6ad8b22705
 ---> b779a9da7ac9
Step 6/6 : RUN chmod -R go-w /usr/share/filebeat/
 ---> Running in bb9638d12090
Removing intermediate container bb9638d12090
 ---> 85ec125594ee
Successfully built 85ec125594ee
Successfully tagged filebeatimage:latest
To check if the image was built successfully:
$ docker images
REPOSITORY      TAG           IMAGE ID            CREATED             SIZE
filebeatimage   latest        85ec125594ee        7 seconds ago       514MB
For the filebeat_elk container, we created two mount points using the parameter -v;
-
/var/lib/docker/containers:/usr/share/dockerlogs/data: we project the logs of the host machine, which are in/var/lib/docker/containersin/usr/share/dockerlogs/datainside a docker container. Please note that you used:ro, which means it has read-only permission.
-
/var/run/docker.socklinked to the Filebeat container docker daemon, which allows the Filebeat container to collect Docker metadata and container logs.
Installing Filebeat via DEB:
There is an alternative way to install Filebeat on your host machine. At the time of this writing, Filebeat version is 7.5.1, you can download the latest filebeat version from here…
To install the downloaded .deb file:
$ wget https://artifacts.elastic.co/downloads/beats/filebeat/filebeat-7.5.1-amd64.deb

$ sudo dpkg -i filebeat-7.5.1-amd64.deb
You can find the config file in the directory /etc/filebeat/filebeat.yml…
Step 2 – Configuring ELK or Elastic Stack
You can use a remote server to host your ELK stack, or run containers on an existing system.
Before starting, make sure the following ports are listening:
-
Elasticsearch – port 9200 and port 9300
-
Logstash – port 5044
-
Kibana – port 5601
ElasticSearch:
We are going to use the most recent official Elasticsearch image. So, let’s start by pulling the image from Docker Hub:
$ docker pull docker.elastic.co/elasticsearch/elasticsearch:7.5.1
7.5.1: Pulling from elasticsearch/elasticsearch
c808caf183b6: Already exists
05ff3f896999: Pull complete
82fb7fb0a94e: Pull complete
c4d0024708f4: Pull complete
136650a16cfe: Pull complete
968db096c092: Pull complete
42547e91692f: Pull complete
Digest: sha256:b0960105e830085acbb1f9c8001f58626506ce118f33816ea5d38c772bfc7e6c
Status: Downloaded newer image for docker.elastic.co/elasticsearch/elasticsearch:7.5.1
docker.elastic.co/elasticsearch/elasticsearch:7.5.1
Now create a directory called docker_elk that will contain all your config and Dockerfile:
$ mkdir docker_elk && cd $_Inside docker_elk, create another directory for elasticsearch and create Dockerfile and elasticsearch.yml:
$ mkdir elasticsearch && cd $_
$ touch Dockerfile && touch elasticsearch.yml
Open elasticsearch.yml file in any text editor and copy configuration settings as is:
---
cluster.name: "docker-cluster"
network.host: 0.0.0.0

xpack.license.self_generated.type: basic
xpack.security.enabled: true
xpack.monitoring.collection.enabled: true
Please note that you can change xpack.license.self_generated.type from basic to trial if you want to try the commercial version of x-pack for 30 days.
Open the Dockerfile in any text editor, copy the lines below and paste them as they are:
FROM docker.elastic.co/elasticsearch/elasticsearch:7.5.1
COPY --chown=elasticsearch:elasticsearch ./elasticsearch.yml /usr/share/elasticsearch/config/
Team chown is intended to change the owner of a file to elasticsearch, just like other files in the container.
Kibana:
Now we’re going to set up a Dockerfile for Kibana, and again you need to pull up the latest image from the Elastic Docker registry:
$ docker pull docker.elastic.co/kibana/kibana:7.5.1
7.5.1: Pulling from kibana/kibana
c808caf183b6: Already exists
e12a414b7b04: Pull complete
20714d0b39d8: Pull complete
393e0a5bccf2: Pull complete
b142626e938b: Pull complete
b28e35a143ca: Pull complete
728725922476: Pull complete
96692e1a8406: Pull complete
e4c3cbe1dbbe: Pull complete
bb6fc46a19d1: Pull complete
Digest: sha256:12b5e37e0f960108750e84f6b2f8acce409e01399992636b2a47d88bbc7c2611
Status: Downloaded newer image for docker.elastic.co/kibana/kibana:7.5.1
docker.elastic.co/kibana/kibana:7.5.1
Create a directory inside your docker_elk, and inside it you have to create Dockerfile and kibana.yml:
$ mkdir kibana && cd $_
$ touch Dockerfile && touch kibana.yml
kibana.yml will consist of the following configurations. Please note that you need to change the values elasticsearch.user and elasticsearch.password:
---
server.name: kibana
server.host: "0"
elasticsearch.hosts: [ "http://elasticsearch:9200" ]
xpack.monitoring.ui.container.elasticsearch.enabled: true

elasticsearch.username: elastic
elasticsearch.password: yourstrongpasswordhere
While in the Dockerfile it will look something like this:
FROM docker.elastic.co/kibana/kibana:7.5.1
COPY ./kibana.yml /usr/share/kibana/config/
Logstash:
A container image for Logstash is available in the Elastic Docker registry. Again, at the time of writing the current version is 7.5.1, the latest version of Logstash you can find here…
$ docker pull docker.elastic.co/logstash/logstash:7.5.1
7.5.1: Pulling from logstash/logstash
c808caf183b6: Already exists
7c07521065ed: Pull complete
d0d212a3b734: Pull complete
418bd04a229b: Pull complete
b22f374f97b1: Pull complete
b65908943591: Pull complete
2ee12bfc6e9c: Pull complete
309701bd1d88: Pull complete
b3555469618d: Pull complete
2834c4c48906: Pull complete
bae432e5da20: Pull complete
Digest: sha256:5bc89224f65459072931bc782943a931f13b92a1a060261741897e724996ac1a
Status: Downloaded newer image for docker.elastic.co/logstash/logstash:7.5.1
docker.elastic.co/logstash/logstash:7.5.1
Now create a directory for Logstash inside docker_elk and add the required files as shown below:
$ mkdir logstash && cd $_
$ touch Dockerfile && touch logstash.yml
Copy the lines below to logstash.yml. Make sure you enter the correct username and password in xpack.monitoring.elasticsearch.username and xpack.monitoring.elasticsearch.password respectively:
---
http.host: "0.0.0.0"
xpack.monitoring.elasticsearch.hosts: [ "http://elasticsearch:9200" ]

xpack.monitoring.enabled: true
xpack.monitoring.elasticsearch.username: elastic
xpack.monitoring.elasticsearch.password: yourstrongpasswordhere
Now add the following lines to your Dockerfile:
FROM docker.elastic.co/logstash/logstash:7.5.1
COPY ./logstash.yml /usr/share/logstash/config/
COPY ./logstash.conf /usr/share/logstash/pipeline/
In addition, you need to create a logstash.conf file. Here in elasticsearch reference you will find host, user and password, make sure you change the values according to your system:
input {
    tcp {
    port => 5000
    codec => json
  }
}
output {
  elasticsearch {
    hosts => "elasticsearch:9200"
    user => elastic
    password => yourstrongpasswordhere
  }
}
Once you’ve finished installing your stack components, your project’s directory structure should look like this:
.
├── elasticsearch
│   ├── Dockerfile
│   └── elasticsearch.yml
├── kibana
│   ├── Dockerfile
│   └── kibana.yml
└── logstash
    ├── Dockerfile
    ├── logstash.conf
    └── logstash.yml

3 directories, 7 files
Now it’s time to create a Docker Compose file that will allow you to start the stack.
Step 3 – Docker Compose
Create a docker-compose.yml file in the docker_elk directory. This is where you will define and run your multi-container application composed of Elasticsearch, Kibana, and Logstash.
You can copy the below context to your docker-compose.yml file. Make sure you change the values ELASTIC_PASSWORD and ES_JAVA_OPTS… In this guide for ES_JAVA_OPTS is set to 256MB, but in real-life scenarios it may be necessary to increase the heap size according to your requests.
version: '3.2'

services:
 elasticsearch:
   build:
     context: elasticsearch/
   volumes:
     - type: volume
       source: elasticsearch
       target: /usr/share/elasticsearch/data
   ports:
     - "9200:9200"
     - "9300:9300"
   environment:
     ES_JAVA_OPTS: "-Xmx256m -Xms256m"
     ELASTIC_PASSWORD: yourstrongpasswordhere
     discovery.type: single-node
   networks:
     - elk_stack

 logstash:
   build:
     context: logstash/
   ports:
     - "5000:5000"
     - "9600:9600"
   environment:
     LS_JAVA_OPTS: "-Xmx256m -Xms256m"
   networks:
     - elk_stack
   depends_on:
     - elasticsearch

 kibana:
   build:
     context: kibana/
   ports:
     - "5601:5601"
   networks:
     - elk_stack
   depends_on:
     - elasticsearch

networks:
 elk_stack:
   driver: bridge

volumes:
 elasticsearch:
Now, in order to build the ELK stack, you need to run the following command in the directory
docker_elk :
$ docker-compose up -d
Starting elastic_elk ... done
Starting kibana_elk   ... done
Starting logstash_elk ... done
Make sure the pipeline is working fine – run the following command to see the Elasticsearch indexes:
$ curl 'localhost:9200/_cat/indices?v' -u elastic:yourstrongpasswordhere

health status index                             uuid                   pri rep docs.count docs.deleted store.size pri.store.size
green  open   .triggered_watches                m-l01yMmT7y2PYU4mZ6-RA   1   0          0            0      6.5kb          6.5kb
green  open   .watcher-history-10-2020.01.10    SX3iYGedRKKCC6JLx_W8fA   1   0       1523            0        2mb            2mb
green  open   .management-beats                 ThHV2q9iSfiYo__s2rouIw   1   0          6            1     40.5kb         40.5kb
green  open   .ml-annotations-6                 PwK7Zuw7RjytoWFuCCulJg   1   0          0            0       283b           283b
green  open   .monitoring-kibana-7-2020.01.10   8xVnx0ksTHShds7yDlHQvw   1   0       1006            0    385.4kb        385.4kb
green  open   .monitoring-es-7-2020.01.10       CZd89LiNS7q-RepP5ZWhEQ   1   0      36412          340     16.4mb         16.4mb
green  open   .apm-agent-configuration          e7PRBda_QdGrWtV6KECsMA   1   0          0            0       283b           283b
green  open   .ml-anomalies-shared              MddTZQ7-QBaHNTSmOtUqiQ   1   0          1            0      5.5kb          5.5kb
green  open   .kibana_1                         akgBeG32QcS7AhjBOed3LA   1   0       1105           28    687.1kb        687.1kb
green  open   .ml-config                        CTLI-eNdTkyBmgLj3JVrEA   1   0         22            0     56.6kb         56.6kb
green  open   .ml-state                         gKx28CMGQiuZyx82bNUoYg   1   0          0            0       283b           283b
green  open   .security-7                       krH4NlJeThyQRA-hwhPXEA   1   0         36            0     83.6kb         83.6kb
green  open   .logstash                         7wxswFtbR3eepuWZHEIR9w   1   0          0            0       281b           281b
green  open   .kibana_task_manager_1            ft60q2R8R8-nviAyc0caoQ   1   0          2            1     16.2kb         16.2kb
yellow open   filebeat-7.5.1-2020.01.10-000001  1-RGhyG9Tf-wGcepQ49mmg   1   1          0            0       283b           283b
green  open   .monitoring-alerts-7              TLxewhFyTKycI9IsjX0iVg   1   0          6            0     40.9kb         40.9kb
green  open   .monitoring-logstash-7-2020.01.10 dc_S5BhsRNuukwTxbrxvLw   1   0       4774            0      1.1mb          1.1mb
green  open   .watches                          x7QAcAQZTrab-pQuvonXpg   1   0          6            6    120.2kb        120.2kb
green  open   .ml-notifications-000001          vFYzmHorTVKZplMuW7VSmw   1   0         52            0     81.6kb         81.6kb
Now it’s time to visit our Kibana dashboard. Open your browser and enter the URL http: // your-ip-addr-here: 5601. Now enter the predefined username and password; in our case it is elastic and yourstrongpasswordhere respectively.
In your Kibana dashboard, go to the “Management“(Management) and in the section”Kibana»Click«Index Patterns “ (Index templates). On the first line, you will find the filebeat- * index, which has already been identified by Kibana.
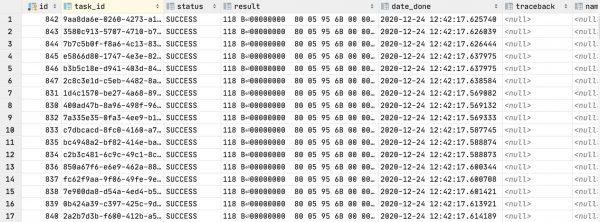
Now navigate to the Discover tag in your Kibana dashboard and view the container logs along with metadata according to your chosen index template, which might look something like this:
Conclusion:
You have now installed and configured the ELK Stack on your host machine, which collects the raw logs from your Docker onto a stack that can later be parsed or used to debug applications.
About the author – Sudip – founder Javelynn and Solution Architect with over 15 years of experience. He loves to share his knowledge, writes regularly for Hackernoon, DZone, Appfleet and many other resources. And if he is not busy with this at the moment, he is probably fishing or playing chess.
Learn more about the ELK Express Course.
Watch online meeting with a teacher express course ELK.


Filebeat indices is not being created in kibana dashboard !
my question is you just build the filebeat docker image , neither you run filebeat docker container nor you have used in docker compose to run it.