Bernoulli vs. Biden
Recently, more and more analytical reviews of election results have appeared, which examine them from the point of view of the laws of statistics and are usually aimed at studying unusual phenomena that signal possible fraud (see. “Gauss vs. Churov” etc. publications). It seems that the just-concluded presidential elections in the United States (vote counting is still ongoing, and for an unprecedentedly long time) will give an additional impetus to the development of this “electoral mathematics”…
Formulation of the problem
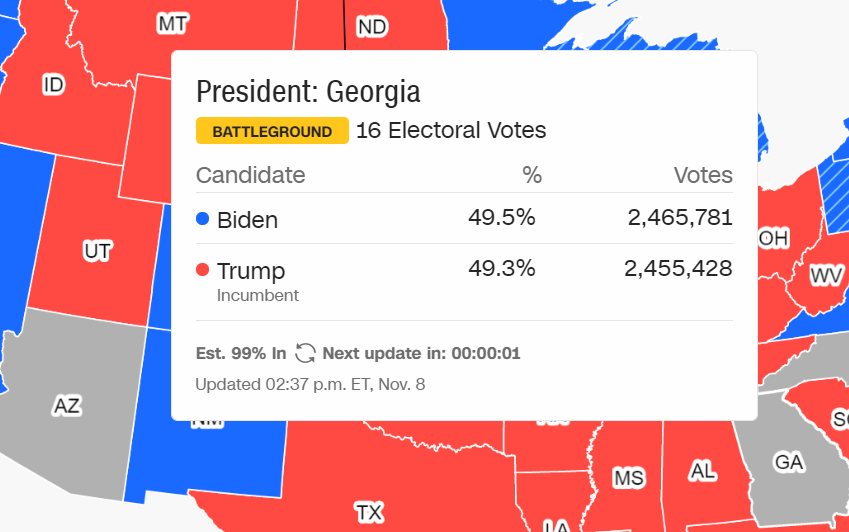
It so happened that, starting November 5, I began to follow the interim results of the counting of votes in the state of Georgia. Then 95% of the votes were counted, the ratio was 49.6 / 49.1 in favor of Trump, i.e. he was half a percent ahead. Purely for demonstration reasons (and I do various educational content and give lectures to students), I decided to assess the likelihood that the state “will turn over”, i.e. the final result will be in Biden’s favor. Actually, on November 5th I started streaming my calculations, but then I got distracted and stopped broadcasting, but the recording with the original data remained. When I started writing this article, at 9 am ET on November 6th, 99% of the ballots were counted, the ratio of votes at this moment you see on the splash screen, and you can see the current results for yourself on CNNfrom where I get the data. By the way, at the time of publication of this article, two days later, i.e. 9am ET on November 8th, there were still no final results and the scoreboard was still showing 99%, but with an even more convincing result in Biden’s favor.
The natural model that I decided to take as a basis was the model of independent tests, i.e. classic Bernoulli scheme… Drawing an analogy between the choice of each of the remaining 100 thousand voters (for Trump – for Biden) and tossing a coin 100 times (heads – tails), I’m going to estimate the mentioned probability of Biden winning in Georgia. Invalid ballots and votes in support of other candidates will not be counted. Trump is loved more in Russia, so let’s agree to consider the vote for him a success (x = 1), and the vote against – a failure (x = 0). I want to say right away that in this article I do not want to discuss politics and draw any conclusions about falsifications, etc., but devote it to a sketch of the simulation of the Bernoulli scheme in Mathcad Express…
Bernoulli Scheme: Monte Carlo Model
So let’s assume that the vote of every voter in Georgia is like tossing a coin, since the likelihood of success (for Trump) or failure (for Biden), judging by the 95% of ballots counted, is almost equal. Let’s, following the Monte Carlo methods, generate a vector x from N = 1000 random numbers, each of which (0 or 1) is added to the sample with an equal 50% probability:

The penultimate line displays the first few components of the vector x, and the last line contains the sample mean (which is close to the mathematical expectation 0.5).
It’s for now “model of behavior of one voter”… And if we want to add another one, i.e. to simulate a double toss of a coin, then it is possible to generate not one, but two pseudo-random numbers: x1 and x2, but we can judge the occurrence of a certain number of successes and failures by simply calculating the sum of these numbers x = x1 + x2. For example, this is how the vectors x1, x2 and x will look like for N = 10 double throws:

In order to automate the calculation of the drop rate, for example, of two successes (1 + 1), you just need to count the number of twos in the vector x. This can be done using the conditional if statement, which is available in the free Mathcad Express.

Multiple throwing of a coin in Mathcad Express can be organized more easily, without involving variables x1 and x2, immediately counting x using the same built-in function rbinom(N,M,p), where M is the number of throws, and p = 0.5 is the probability of success:

Modeling elections
Now everything is ready for the main task. We can easily simulate the behavior of M = 250,000 voters in Georgia and calculate the desired probability estimate, i.e. average frequency of events x For Trump, T = 2,429,783 votes were cast, and Biden received B = 2,406,774, i.e. 50.24% and 49.76% respectively (we count other votes, neither for Trump nor for Biden). Those. all at that time, about 5 million votes were counted, i.e. 95% of the ballots. Therefore, we can assume that it remains to calculate the remaining 5%, i.e. approximately 250,000 ballots. The gap between Trump and Biden was 2,429,783 – 2,406,774 = 23,009. In other words, we need to estimate the likelihood that the number of successes in the sample for M = 250,000 coin tosses will be 23,000 fewer than failures. In our designations, it is necessary to establish with what probability x will not exceed A = 250,000 / 2 – 11,500 (then the gap between 125 + 11.5 thousand and 125-11.5 thousand will be just at least 23 thousand). If we take the sample size N = 10 million tests, then the Mathcad pseudorandom number generator does not give a single case x If we reduce (for the sake of curiosity) A 10 times and try to calculate the average frequency of an event x Bernoulli’s model is good because analytical formulas for calculating such probabilities are known for it. In particular, the problem under consideration can be solved using the Moivre-Laplace integral theorem, which gives the same order of probability (one millionth for the condition x But about analytical formulas for the Bernoulli scheme in the next article. And this one I finish at 1 am on 09.11.2020 Moscow time (corresponds to 15 hours ET on 08.11 in the USA). And the reader himself can estimate the likelihood of the outcome, which is eventually realized, based on a screenshot from the CNN website. On it, 99% numbers show us and the whole world that “last mile” can’t get through, and the unfortunate 1 percent of the ballots in Georgia are deadly and resist calculations to the last.")

Analytical evaluations