Bamboo, Mito-leaf and Detail, or how to prepare for a meeting with pandas

The first library I would like to introduce you to is Bamboolib. It’s no secret that pandas eat bamboo, and like all food, you have to pay for it. Yes, Bamboolib has a paid version that supports Apache Spark, and also has the ability to use its own internal libraries and there is no plugin limit, otherwise the free version is enough.
Install:
pip install — upgrade bamboolib — user
We import:
import bamboolib as bam
We work:
bam
After that, a graphical interface appears and the ability to open a .csv file …

…and work with it through the GUI, as with regular Excel. Read table:
Note:
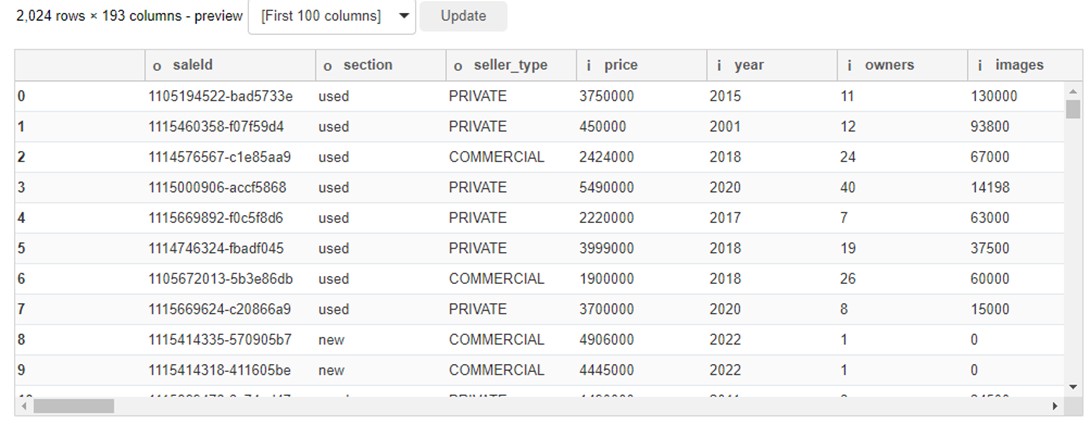
§ The table has categorical features of the vehicle equipment – “specials” are placed in columns, which is why the frame is “inflated” to 193 (!) columns. Normally the table wouldn’t fit on the standard output of the notebook and we’d have to use the display.max_columns option to look at all the fields, but here the scrollbar is already there.
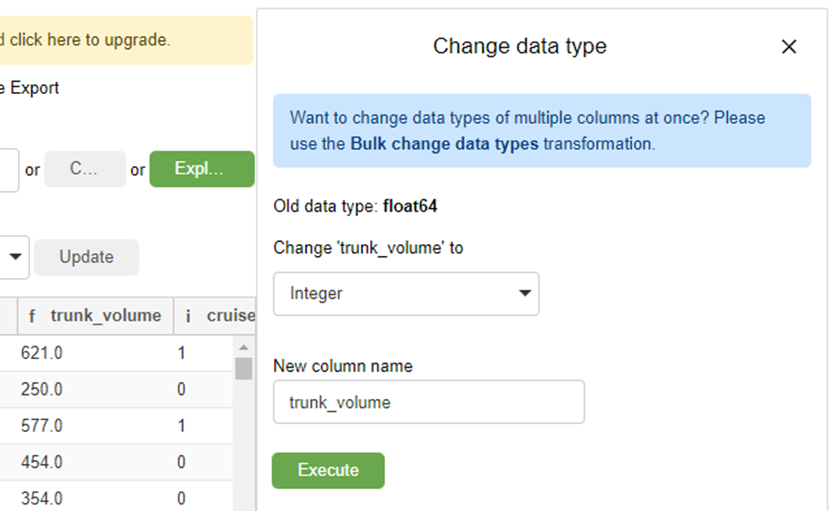
§ The names of the columns contain a prefix, in the screenshot you can see “o” and “I” – this is how we are told that the data types in the columns are object and int, respectively. Longitude, latitude, fuel consumption and fuel tank volume “f” – float. In this case, the volume of the tank does not have values other than 0 after the dot, and it can be converted to int simply by clicking on the column, selecting an integer type from the drop-down list and clicking Execute.
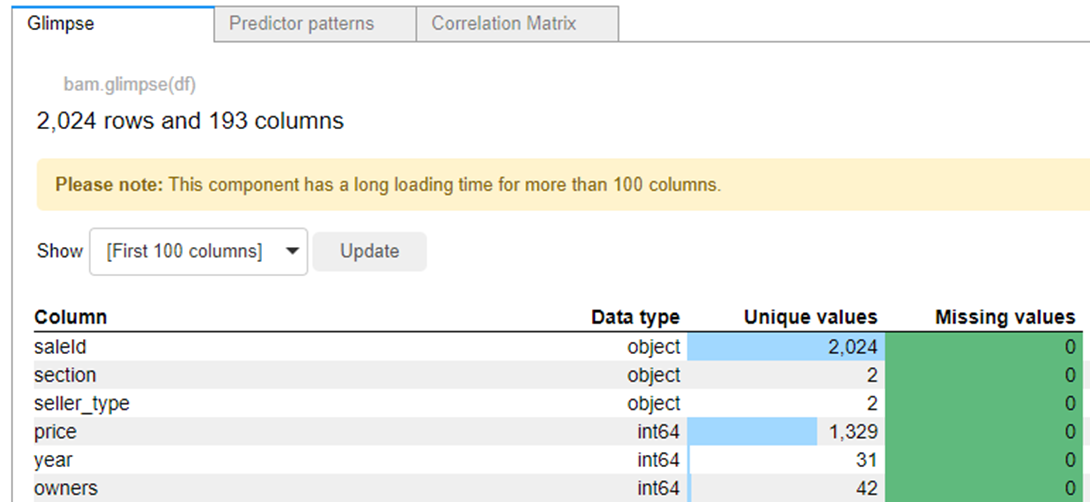
The big green button “Explore DataFrame” will allow us to see both the data types of all other columns, and the number of gaps and unique values, and in the adjacent tabs a heat map and a correlation matrix are found.
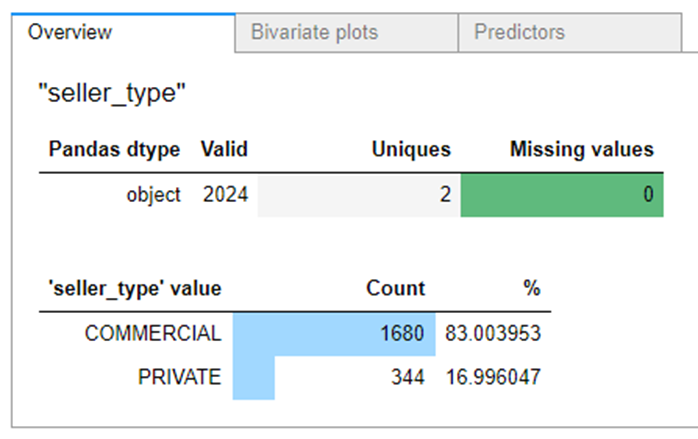
If you need to get acquainted in detail with the statistics of the content in the Seller_type column, we fall into it with one click and see the distribution, and in the adjacent tabs there are interdependencies.
To the left of the big green Explore DataFrame button, there is a graphing function. I wanted to know which models have the most sales ads:
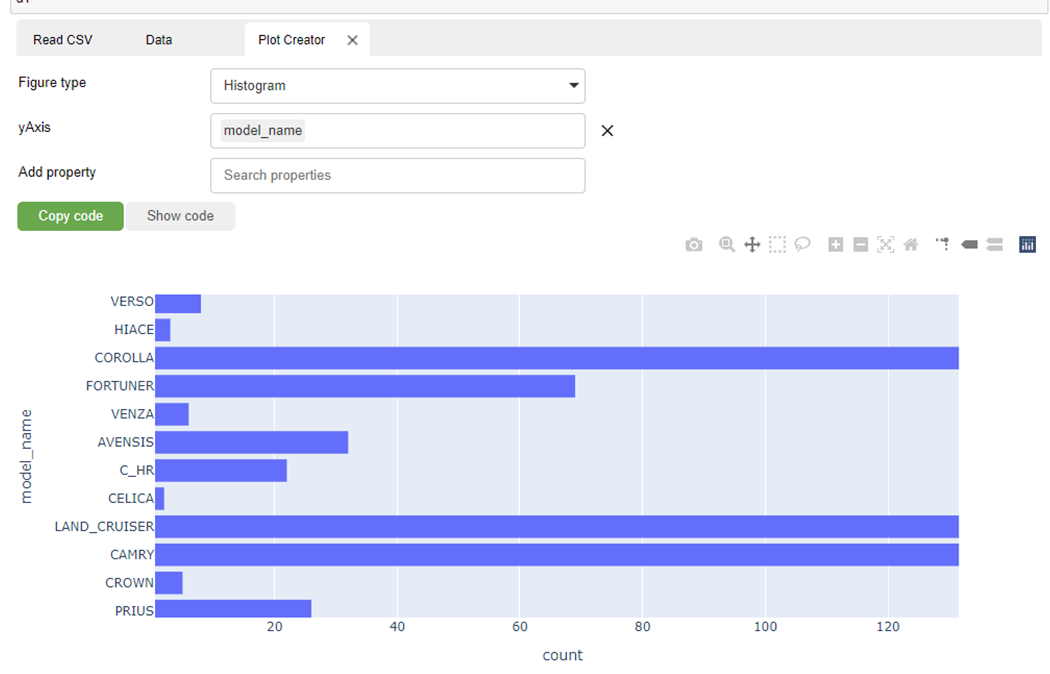
Visualization with plotly and its context menu in the right corner of the graph allow you to work with the graph.
Of course, in addition to EDA and visualization, the library also has methods for working with the dataframe. If you are familiar with “pandas”, then you will be met by the usual set of methods and functions, if not, basic knowledge of English will be enough – all available operations are listed in the drop-down list:
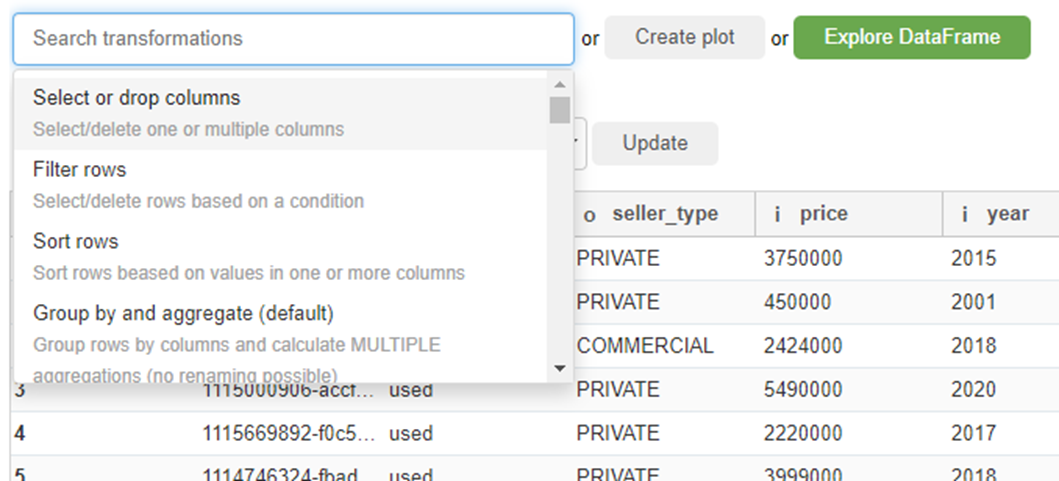
Delete, rename, sort, etc. At the same time, the filtering interface resembles the same source site. For example, we want to view all ads of Toyota 5-door 4×4 for sale in Samara? Please. Sort by price? Nothing easier. Delete columns? This minute.
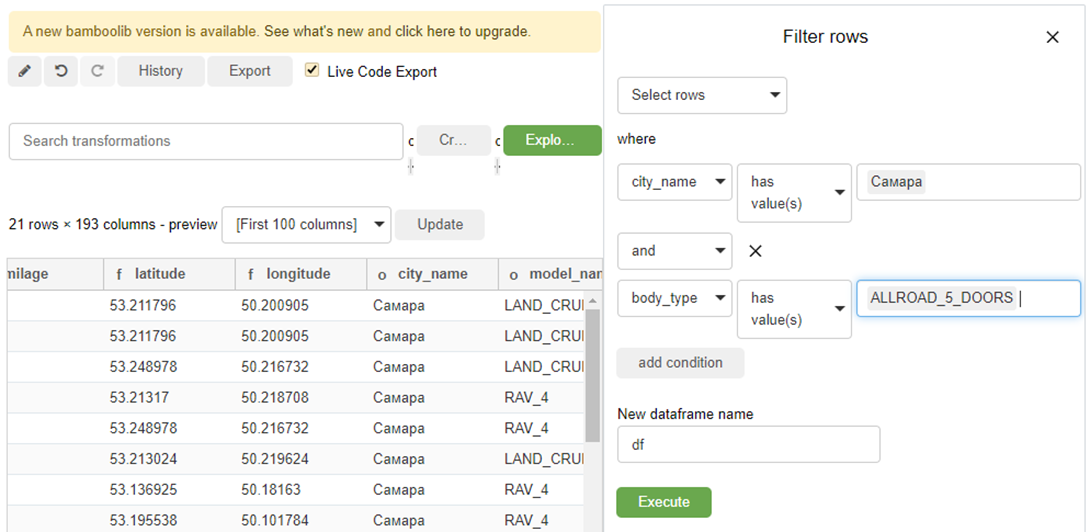
Grouping can also be useful, this is done quite simply, and in addition we get the code that the library wrote for us (including the pandas import) – it can be saved and used even without bamboolib installed!
import pandas as pd
df = pd.read_csv(r'C:\Users\olegs\Desktop\vato_ru.csv', sep=',', decimal=".")
df = df.loc[(df['city_name'].isin(['Самара'])) & (df['body_type'].isin(['ALLROAD_5_DOORS']))]
df = df.sort_values(by=['price'], ascending=[True])
df = df.drop(columns=['latitude', 'longitude'])
df
As you can see, “out of the box” we are provided with the necessary basic set of data operations, including such things as statistics and graphs.
The library works the same way. Mito. Install:
python -m pip install mitoinstaller
python -m mitoinstaller install
We import:
import mitosheet
We work:
mitosheet.sheet()
Like Bamboolib, Mito has an enterprise version, PRO with additional functionality, and free Open Source. The article will use the latter, which, in addition to tools for researching and transforming data, even claims user support (it was not in the free version of Bamboolib).
After opening the GUI, the difference in the interface immediately catches your eye – the commands are displayed in the “header”, and there is also a pivot table – pivot tables – and the Undo and Redo commands (roll back / return the action) and even STEP HISTORY, which were not in the previous library . There is no grouping option.
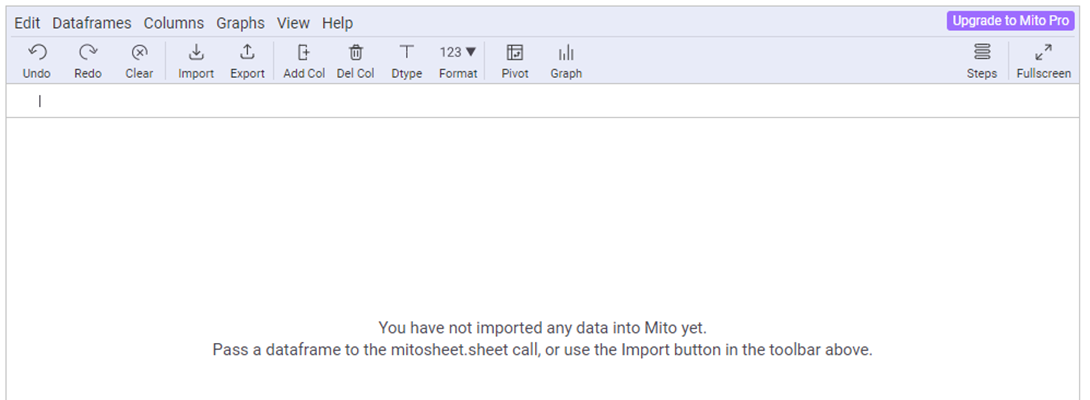
Our dataframe:
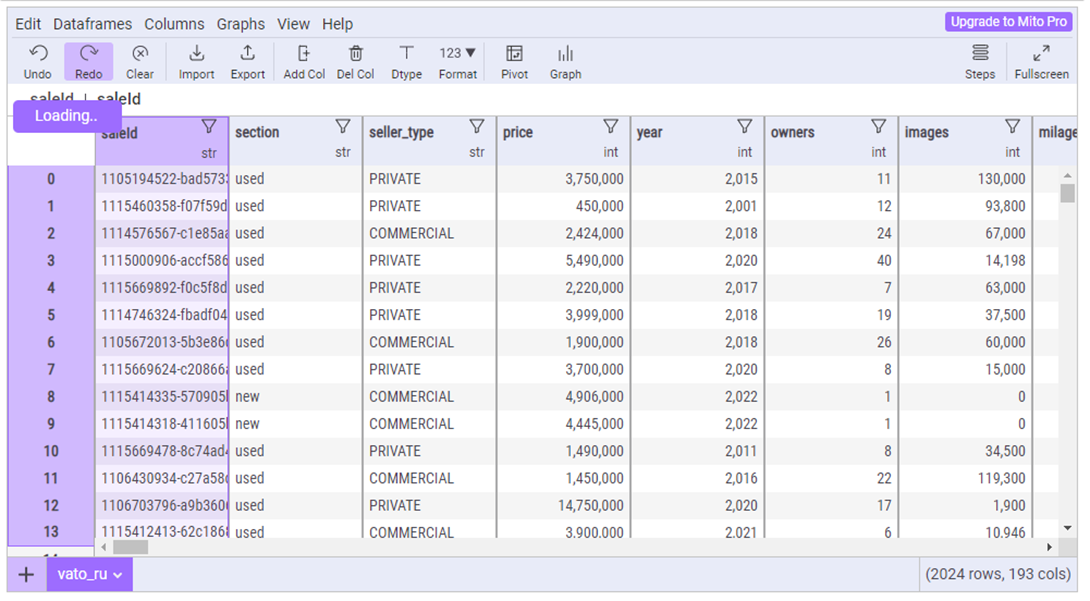
The scrollbars are in place, unlike the dimension. Changing the data type of a column (the names of which, by the way, are different here) is also intuitively simple – let’s repeat the same manipulations with filtering, deleting columns, etc. and compare the code:
# Imported vato_ru.csv
import pandas as pd
vato_ru = pd.read_csv(r'C:\Users\olegs\Desktop\vato_ru.csv')

# Changed trunk_volume to dtype int
vato_ru['trunk_volume'] = vato_ru['trunk_volume'].fillna(0).astype('int')

# Filtered city_name
vato_ru = vato_ru[vato_ru['city_name'] == 'Самара']

# Sorted price in ascending order
vato_ru = vato_ru.sort_values(by='price', ascending=True, na_position='first')

# Filtered body_type
vato_ru = vato_ru[vato_ru['body_type'] == 'ALLROAD_5_DOORS']

# Deleted columns latitude
vato_ru.drop(['latitude'], axis=1, inplace=True)

# Deleted columns longitude
vato_ru.drop(['longitude'], axis=1, inplace=True)
With each manipulation, the frame was also overwritten (except for deleting columns, but the inplace = True parameter was used), and if rollback is necessary, STEP HISTORY saves us. Also among the minor differences is the use of exact match instead of .isin() when filtering (the drop-down list, as in bamboolib, is not here) and a number of others, in addition, each action is commented out.
Statistics are less detailed, but must have attributes are present:
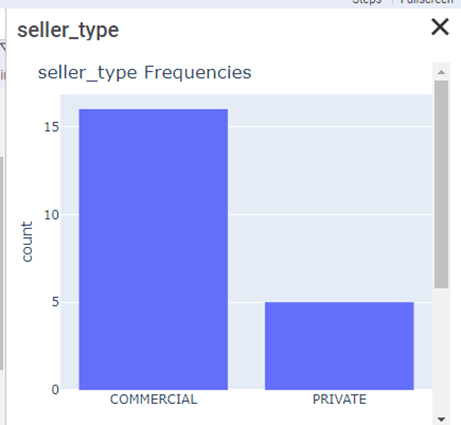
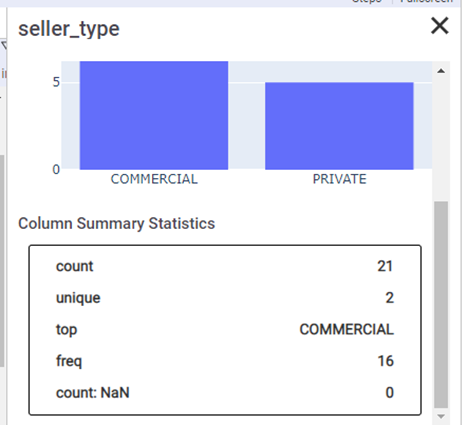
There is no correlation/covariance. The functionality of the visualization block (also on plotly) is sufficient.
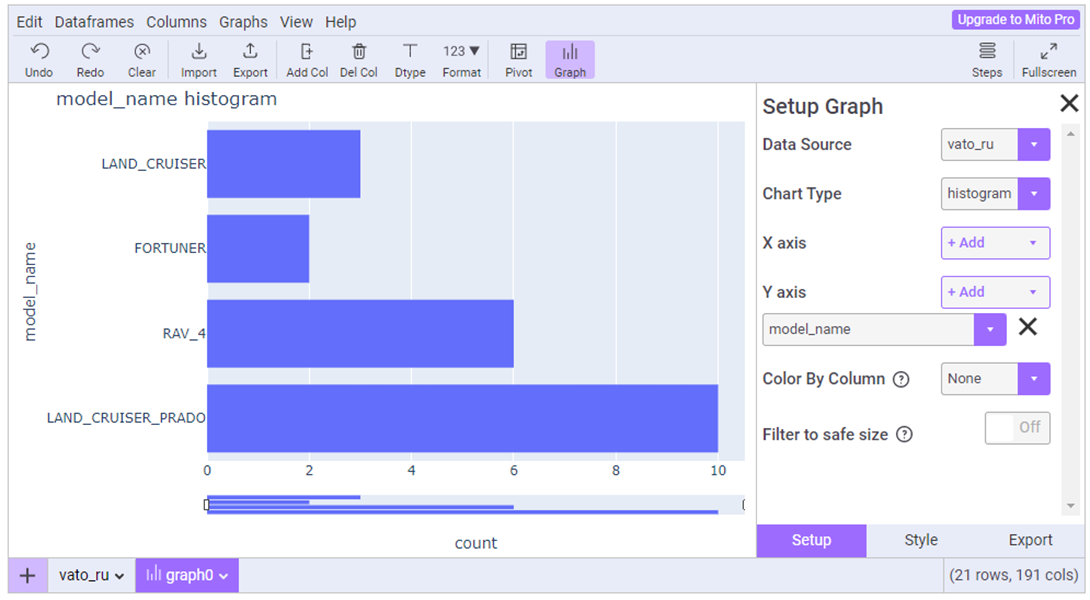
The pluses include the fact that you can load several dataframes, and they will be displayed as tabs, like Excel sheets.
The third library that provides the ability to interactively interact with data in the Python language without knowledge of the Python language is D-Tale. It’s free.
Install:
pip install data
We import:
import dtale
import pandas as pd
We work:
df = pd.read_csv(‘data.csv’)
d = dtale.show(df)
d.open_browser()
Yes, we really had to import pandas ourselves, read the file and even call a couple of functions from dtale, which, compared to the functionality of previous libraries, may seem unforgivably laborious, but:
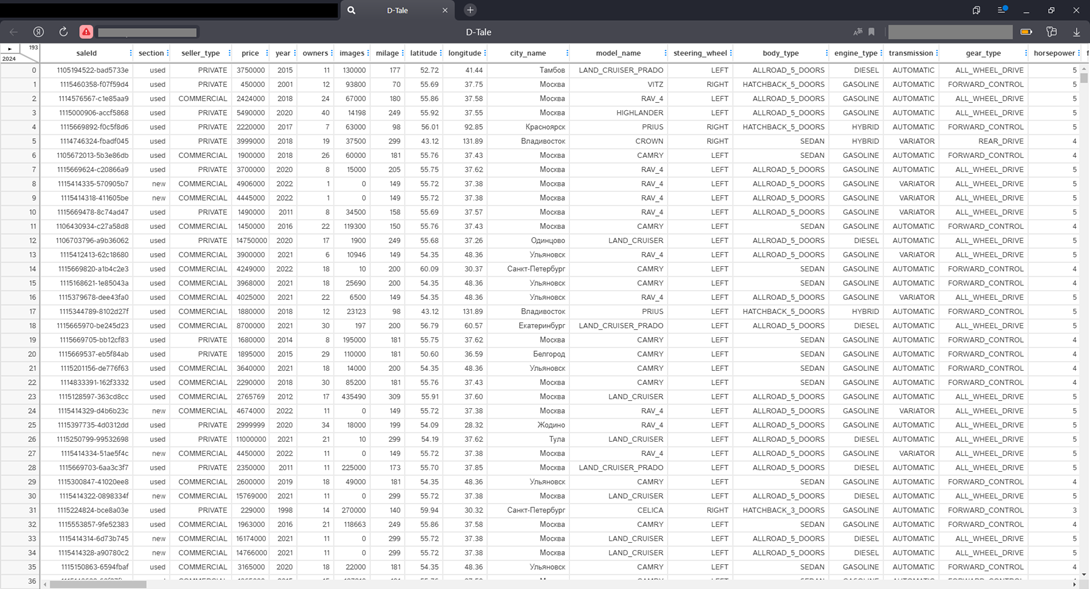
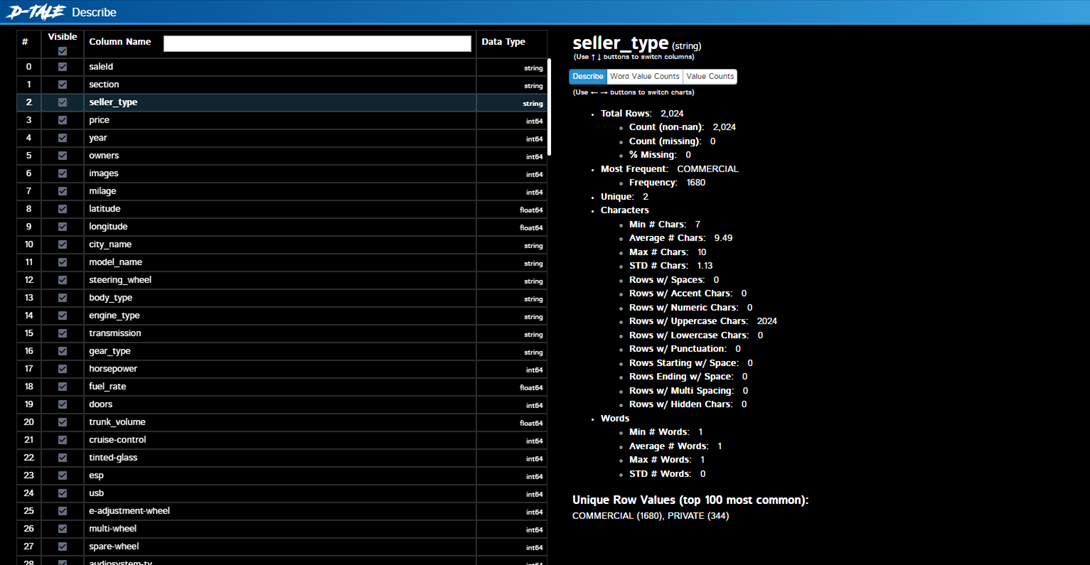
…the frame immediately opens in a separate window! We also immediately see its dimension at the top left and scroll bars, but not a single button or toolbar. Everything is hidden on the button in the upper left corner, when clicked, a rich menu of functions opens – a heat map, correlations, gap analysis, highlighting outliers, graphs, you can even put a dark theme. Compare what the statistics look like (Describe menu) by the “Seller Type” column:
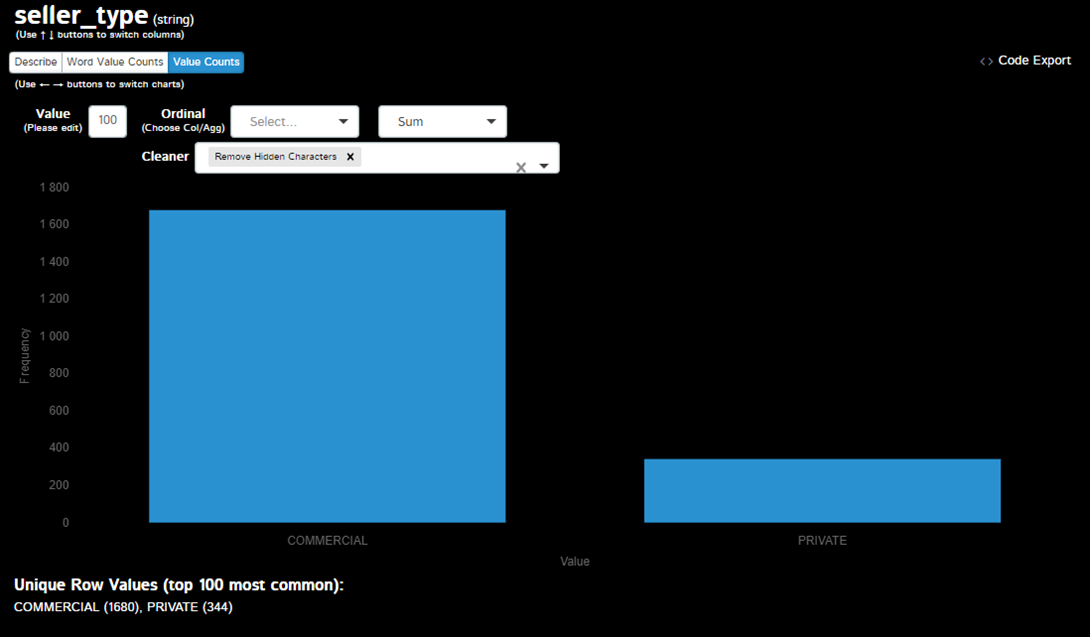
Adjacent tab with value distribution:
The functionality is really impressive, of the previously mentioned functions, there are not only pivot table and group by, but also transpose and resample:

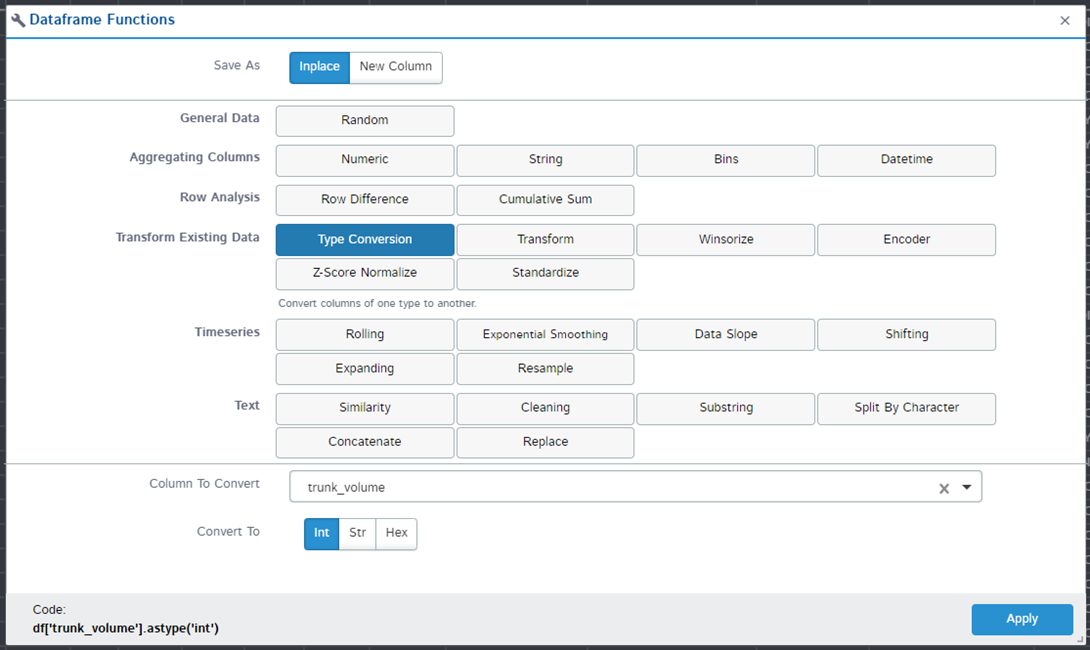
The many supported functions entail an obvious inconvenience – for the simplest conversion of the data type of a column, you must first find it:
… and for filtering, know a little syntax:

I will not demonstrate in detail the work of all available functions, but I will carry out the “traditional” manipulation with the dataframe and upload the resulting code for comparison:
df.loc[:, 'trunk_volume'] = pd.Series(s.astype('int'), name="trunk_volume", index=df['trunk_volume'].index)
df = df[[c for c in df.columns if c not in ['latitude']]]
df = df[[c for c in df.columns if c not in ['longitude']]]
df = df.query("""(city_name == 'Самара') and (body_type == 'ALLROAD_5_DOORS')""")

df = df.sort_values(['price'], ascending=[True])
Note that the removal of columns is done using list inclusion, conversion via Series, and the .query() function is used for filtering, which is very different from previously seen approaches.
As a result, we can say with confidence that in the field of user interfaces for interacting with data there are tools that do not require learning a programming language, but provide a basic, and sometimes even an extended arsenal for working with tables. And this arsenal is large enough for everyone to find a library for themselves according to their needs – with a user-friendly interface or an emphasis on functionality.


