Analysis of the problem “Recognition of traffic signs on frames from a car DVR”, Digital Breakthrough
Introduction
The automotive industry is one of the most high-tech industries, incorporating innovations from various fields to provide drivers and passengers with speed, safety and comfort when driving. The attention of many automakers is now focused on the creation of unmanned vehicles, which implies the introduction of a whole range of software and hardware solutions, including those based on artificial intelligence technologies.
Every year the need for an automatic traffic sign recognition system becomes more and more urgent. These systems are widely used in autopilots and driver assistants to improve the safety of vehicles. The systems can help you adhere to speed limits, comply with travel and overtaking restrictions, which can significantly reduce accidents on the roads.
The task
Develop a solution that can recognize road signs on frames recorded by a car DVR.
Description of input data
train/ — folder, contains 778 frames taken on the DVR;
train.csv – contains a list of signs for each photo;
test/ – contains 388 images on which you want to identify car signs;
test.csv – contains a listing of all images of the test set;
sample_solution.csv – sample file to send;
Data explanation
For the convenience of interpreting the results, road signs were converted into numbers from 1 to 70, where:
number 1 corresponds to the sign under GOST ‘3.24’,
number 2 corresponds to the sign under GOST ‘1.16’,
number 3 corresponds to the sign under GOST ‘5.15.5’,
etc. for the following characters: ‘5.19.1’, ‘5.19.2’, ‘1.20.1’, ‘8.23’, ‘2.1’, ‘4.2.1’, ‘8.22.1’, ‘6.16’, ‘1.22’, ‘1.2’, ‘5.16’, ‘3.27’, ‘6.10.1’, ‘8.2.4’, ‘6.12’, ‘5.15.2’, ‘3.13’, ‘3.1’, ‘3.20’, ‘3.12’, ‘7.14.2’, ‘5.23.1’, ‘2.4’, ‘5.6’, ‘4.2.3’, ‘8.22.3’, ‘5.15.1’, ’7.3′, ‘3’, ‘2.3.1’ ‘, ‘3.11’, ‘6.13’, ‘5.15.4’, ‘8.2.1’, ‘1.34.3’, ‘8.2.2’, ‘5.15.3’, ‘1.17’, ‘4.1.1’, ‘4.1.4’, ‘3.25’, ‘1.20.2’, ‘8.22.2’, ‘6.9.2’, ‘3.2’, ‘5.5’, ‘5.15.7’, ‘7.12’, ‘8.2.3’ ‘, ‘5.24.1’, ‘1.25’, ‘3.28’, ‘5.9.1’, ‘5.15.6’, ‘8.1.1’, ‘1.10’, ‘6.11’, ‘3.4’, ‘6.10’, ‘6.9.1’, ‘8.2.5’, ‘5.15’, ‘4.8.2’, ‘8.22’, ‘5.21’, ‘5.18’.
What to pay attention to
It is important to note that there can be more than one sign in one picture, but the maximum number of them in one photo for our set is eight.
Quality metric
In the task, the accuracy of model recognition is important, so Recall will be applied to each line of the set.
The solution of the problem
Even a quick look at the information about the task immediately makes it clear that the data, to put it mildly, is not enough. We have 70 different classes and a total of 778 study photos. It is useful to build a histogram of the frequencies of occurrence of a particular character in the training set.
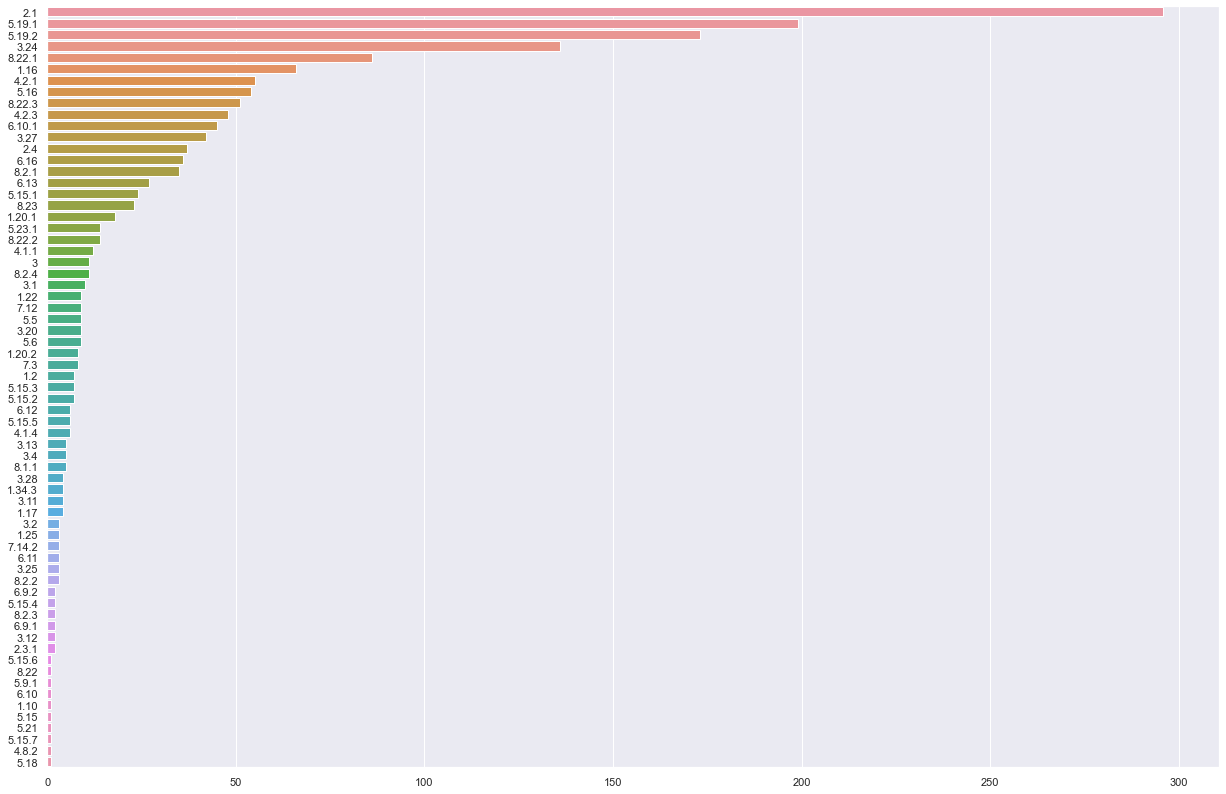
It is also worth noting that the quality of the markings leaves much to be desired, and this despite the fact that there are signs in the list of traffic signs that you cannot recognize in any way. For example, some unknown character “3”. It’s good that these problematic signs are not so common, so we will ignore them.
Alternative dataset
The best fit for our needs is the dataset RTSD. The RTSD dataset contains footage provided by the company “Geocenter Consulting”. Images are taken from a widescreen video recorder, which shoots at a frequency of 5 frames per second. Image resolutions from 1280×720 to 1920×1080. Photos were taken at different times of the year (spring, autumn, winter), at different times of the day (morning, afternoon, evening) and under different weather conditions (rain, snow, bright sun). The set uses 155 traffic signs, marking format – COCO.
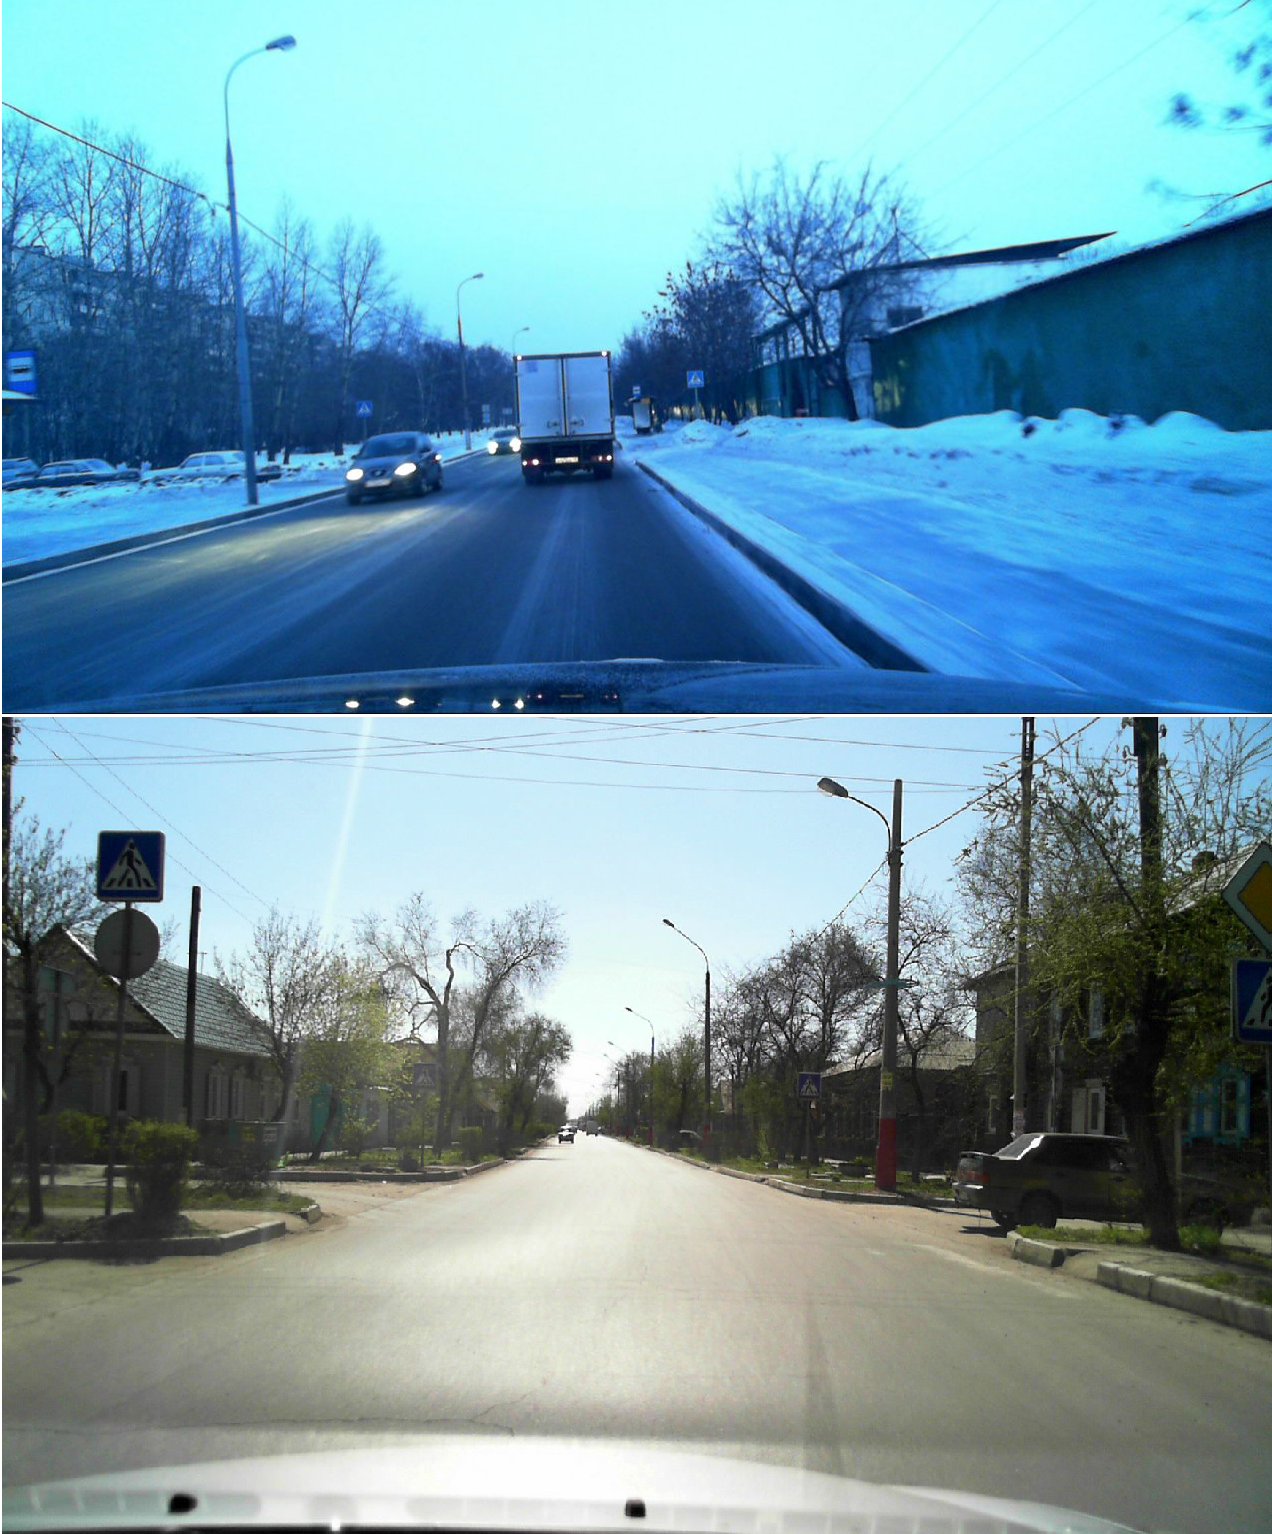
Some statistics
RSTD differs in the number and composition of characters from the data set of our problem. So the next question is brewing by itself – how many characters from the original problem does our dataset cover? Signs from the RTSD set make up 65.2% of the traffic signs in our problem.
As we saw above, signs have different frequencies of occurrence. Let us assume that the ratio of signs in the training and test sets is the same. How much of the train set does the characters that are present in RTSD cover? Signs from the RTSD set cover 72.4% of the volume of all traffic signs in the train set. Thus, we can cover most of the cases without using the train from our task at all. In my opinion, this is 🤡.
And now it’s time to import all the necessary libraries.
import pandas as pd
from tqdm.notebook import tqdm
import os
from shutil import copyfile, move
import sys
import json
Let’s download the dataset from Kaggle.
!pip install kaggle
!kaggle datasets download -d watchman/rtsd-dataset
!7z x rtsd-dataset.zip
Object detector
will act as a detector. yolov5, namely yolov5m6 with a resolution of 1280 pixels. In my opinion, this is the best option, since the traffic signs are small, and the image itself is large; if we train the model at a resolution of 640, we may miss a significant number of traffic signs. Of course, you can always use a different architecture. The purpose of this article is not to choose the optimal architecture, but to demonstrate that it is possible to win prizes in the competition without resorting to organizers markup.
Converting a dataset to YOLO format
There are several ways how this can be done. For example, use the service Roboflow, but then you have to load all the markup into their service, which will take quite a lot of time. As an alternative – cvat, but all this is very long, although it will require only patience and time. You can always turn on hard-mode and write everything yourself. We will use a ready-made script from Ultralyticsbut let’s make one change to it.
!git clone https://github.com/ultralytics/JSON2YOLOYou need to modify line 274 in the general_json2yolo.py file as follows:
h, w, f = img['height'], img['width'], img['file_name'].split('/')[1]Let’s proceed directly to converting the COCO format to the YOLO format.
sys.path.append('./JSON2YOLO')
from JSON2YOLO.general_json2yolo import convert_coco_json

test_path="test_annotation"
train_path="train_annotation"

os.makedirs(train_path, exist_ok=True)
os.makedirs(test_path, exist_ok=True)

move('train_anno.json', os.path.join(train_path, 'train_anno.json'))
move('val_anno.json', os.path.join(test_path, 'val_anno.json'))

for folder in ['labels', 'images']:
    for path in [test_path, train_path]:
        os.makedirs(os.path.join(path, folder), exist_ok=True)

convert_coco_json(train_path)
for file in tqdm(os.listdir(os.path.join('new_dir/labels/train_anno'))):
    move(os.path.join('new_dir/labels/train_anno', file), os.path.join(train_path, 'labels', file))

convert_coco_json('./test_annotation/')
for file in tqdm(os.listdir(os.path.join('new_dir/labels/val_anno'))):
    move(os.path.join('new_dir/labels/val_anno', file), os.path.join(test_path, 'labels', file))
We have the markup, only the images that correspond to it are missing. Well, let’s add them.
test_labels = os.listdir(os.path.join(test_path, 'labels'))
train_labels = os.listdir(os.path.join(train_path, 'labels'))

test_labels = set(map(lambda x: x.split('.')[0], test_labels))
train_labels = set(map(lambda x: x.split('.')[0], train_labels))

images="rtsd-frames/rtsd-frames"
for file in os.listdir(images):
    name = file.split('.')[0]
    if name in train_labels:
        move(os.path.join(images, file), os.path.join(train_path,'images', file))
    if name in test_labels:
        move(os.path.join(images, file), os.path.join(test_path,'images', file))
Let’s create a file “trafic_signs.yaml” with a description of the paths and classes used in the dataset. This is a mandatory requirement for yolov5.
train: /home/jovyan/train_annotation/images  # train images (relative to 'path') 128 images
val: /home/jovyan/test_annotation/images  # val images (relative to 'path') 128 images

nc: 155
names: ['2_1', '1_23', '1_17', '3_24', '8_2_1', '5_20', '5_19_1', '5_16',
'3_25', '6_16', '7_15', '2_2', '2_4', '8_13_1', '4_2_1', '1_20_3', '1_25',
'3_4', '8_3_2', '3_4_1', '4_1_6', '4_2_3', '4_1_1', '1_33', '5_15_5', '3_27',
'1_15', '4_1_2_1', '6_3_1', '8_1_1', '6_7', '5_15_3', '7_3', '1_19', '6_4',
'8_1_4', '8_8', '1_16', '1_11_1', '6_6', '5_15_1', '7_2', '5_15_2', '7_12',
'3_18', '5_6', '5_5', '7_4', '4_1_2', '8_2_2', '7_11', '1_22', '1_27', '2_3_2',
'5_15_2_2', '1_8', '3_13', '2_3', '8_3_3', '2_3_3', '7_7', '1_11', '8_13',
'1_12_2', '1_20', '1_12', '3_32', '2_5', '3_1', '4_8_2', '3_20', '3_2', '2_3_6',
'5_22', '5_18', '2_3_5', '7_5', '8_4_1', '3_14', '1_2', '1_20_2', '4_1_4', '7_6',
'8_1_3', '8_3_1', '4_3', '4_1_5', '8_2_3', '8_2_4', '1_31', '3_10', '4_2_2', '7_1',
'3_28', '4_1_3', '5_4', '5_3', '6_8_2', '3_31', '6_2', '1_21', '3_21', '1_13', '1_14',
'2_3_4', '4_8_3', '6_15_2', '2_6', '3_18_2', '4_1_2_2', '1_7', '3_19', '1_18', '2_7',
'8_5_4', '5_15_7', '5_14', '5_21', '1_1', '6_15_1', '8_6_4', '8_15', '4_5', '3_11',
'8_18', '8_4_4', '3_30', '5_7_1', '5_7_2', '1_5', '3_29', '6_15_3', '5_12', '3_16',
'1_30', '5_11', '1_6', '8_6_2', '6_8_3', '3_12', '3_33', '8_4_3', '5_8', '8_14',
'8_17', '3_6', '1_26', '8_5_2', '6_8_1', '5_17', '1_10', '8_16', '7_18', '7_14', '8_23']
Model Training
!git clone https://github.com/ultralytics/yolov5
!cd "yolov5"
!pip install -r requirements.txt
!python train.py --img 1280 --batch -1 --epochs 40 --data "/home/jovyan/trafic_signs.yaml" --weights yolov5m6.pt --project "hackaton_trafic_signs" --name "yolov5m6"
We have a model that determines traffic signs, let’s move on to the test set.
Prediction on test dataset
Let’s apply our object detector to the test dataset.
!python detect.py --source {путь к тестовому набору} --weights {путь к весам модели} --save-txt --save-conf --name "yolov5m6_signs_test" --imgsz 1280 --conf-thres 0.25Note: The ‘5.19.2’ character is missing from RTSD, but it is in the top 3 most frequent characters in our training set. Let’s see how the detector behaves when there are signs ‘5.19.1’ and ‘5.19.2’ on the image. It turns out that if we met ‘5.19.1’ twice as a result of the detector’s work, then this is nothing but ‘5.19.1’ and ‘5.19.2’.
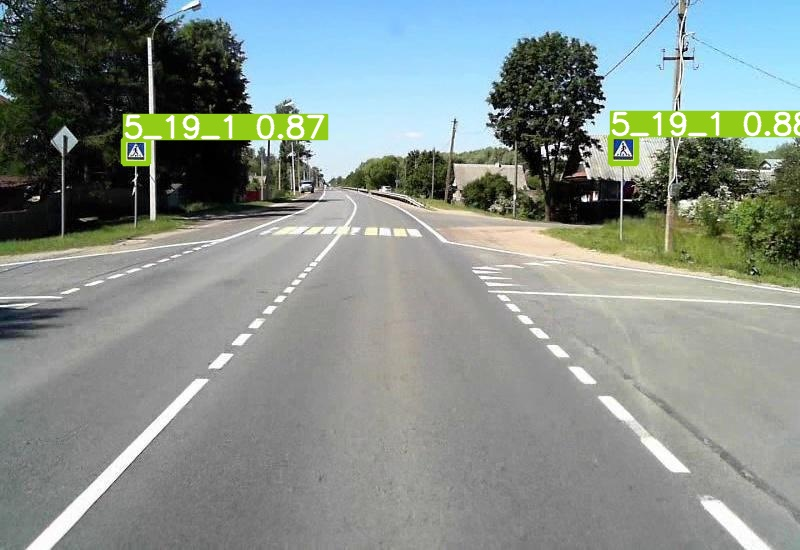
Let’s learn how to convert traffic signs from RTSD to the format of our task.
sings_rtsd = {"2_1": 1, "1_23": 2, "1_17": 3, "3_24": 4, "8_2_1": 5, "5_20": 6, "5_19_1": 7, "5_16": 8, "3_25": 9, "6_16": 10, "7_15": 11, "2_2": 12, "2_4": 13, "8_13_1": 14, "4_2_1": 15, "1_20_3": 16, "1_25": 17, "3_4": 18, "8_3_2": 19, "3_4_1": 20, "4_1_6": 21, "4_2_3": 22, "4_1_1": 23, "1_33": 24, "5_15_5": 25, "3_27": 26, "1_15": 27, "4_1_2_1": 28, "6_3_1": 29, "8_1_1": 30, "6_7": 31, "5_15_3": 32, "7_3": 33, "1_19": 34, "6_4": 35, "8_1_4": 36, "8_8": 37, "1_16": 38, "1_11_1": 39, "6_6": 40, "5_15_1": 41, "7_2": 42, "5_15_2": 43, "7_12": 44, "3_18": 45, "5_6": 46, "5_5": 47, "7_4": 48, "4_1_2": 49, "8_2_2": 50, "7_11": 51, "1_22": 52, "1_27": 53, "2_3_2": 54, "5_15_2_2": 55, "1_8": 56, "3_13": 57, "2_3": 58, "8_3_3": 59, "2_3_3": 60, "7_7": 61, "1_11": 62, "8_13": 63, "1_12_2": 64, "1_20": 65, "1_12": 66, "3_32": 67, "2_5": 68, "3_1": 69, "4_8_2": 70, "3_20": 71, "3_2": 72, "2_3_6": 73, "5_22": 74, "5_18": 75, "2_3_5": 76, "7_5": 77, "8_4_1": 78, "3_14": 79, "1_2": 80, "1_20_2": 81, "4_1_4": 82, "7_6": 83, "8_1_3": 84, "8_3_1": 85, "4_3": 86, "4_1_5": 87, "8_2_3": 88, "8_2_4": 89, "1_31": 90, "3_10": 91, "4_2_2": 92, "7_1": 93, "3_28": 94, "4_1_3": 95, "5_4": 96, "5_3": 97, "6_8_2": 98, "3_31": 99, "6_2": 100, "1_21": 101, "3_21": 102, "1_13": 103, "1_14": 104, "2_3_4": 105, "4_8_3": 106, "6_15_2": 107, "2_6": 108, "3_18_2": 109, "4_1_2_2": 110, "1_7": 111, "3_19": 112, "1_18": 113, "2_7": 114, "8_5_4": 115, "5_15_7": 116, "5_14": 117, "5_21": 118, "1_1": 119, "6_15_1": 120, "8_6_4": 121, "8_15": 122, "4_5": 123, "3_11": 124, "8_18": 125, "8_4_4": 126, "3_30": 127, "5_7_1": 128, "5_7_2": 129, "1_5": 130, "3_29": 131, "6_15_3": 132, "5_12": 133, "3_16": 134, "1_30": 135, "5_11": 136, "1_6": 137, "8_6_2": 138, "6_8_3": 139, "3_12": 140, "3_33": 141, "8_4_3": 142, "5_8": 143, "8_14": 144, "8_17": 145, "3_6": 146, "1_26": 147, "8_5_2": 148, "6_8_1": 149, "5_17": 150, "1_10": 151, "8_16": 152, "7_18": 153, "7_14": 154, "8_23": 155}
sings_rtsd = dict(zip(range(len(sings_rtsd)), [x.replace('_','.') for x in list(sings_rtsd.keys())]))

sings_input = ['3.24', '1.16', '5.15.5', '5.19.1', '5.19.2', '1.20.1', '8.23',
'2.1', '4.2.1', '8.22.1', '6.16', '1.22', '1.2', '5.16', '3.27',
'6.10.1', '8.2.4', '6.12', '5.15.2', '3.13', '3.1', '3.20', '3.12',
'7.14.2', '5.23.1', '2.4', '5.6', '4.2.3', '8.22.3', '5.15.1',
'7.3', '3', '2.3.1', '3.11', '6.13', '5.15.4', '8.2.1', '1.34.3',
'8.2.2', '5.15.3', '1.17', '4.1.1', '4.1.4', '3.25', '1.20.2',
'8.22.2', '6.9.2', '3.2', '5.5', '5.15.7', '7.12', '8.2.3',
'5.24.1', '1.25', '3.28', '5.9.1', '5.15.6', '8.1.1', '1.10',
'6.11', '3.4', '6.10', '6.9.1', '8.2.5', '5.15', '4.8.2', '8.22',
'5.21', '5.18']
Let’s define auxiliary functions.
def parse_labeltxt(path):
    with open(os.path.join(path), 'r') as file:
        lines = file.readlines()
        labels = [sings_rtsd[int(x.split(' ')[0])] for x in lines]
        if labels.count('5.19.1')>1:
            labels.append('5.19.2')
        labels = list(set(labels))
        return labels

def rtsd2predict(labels):
    int_labels = []
    for sign in labels:
        if sign in sings_input:
            int_labels.append(sings_input.index(sign) + 1)
    return int_labels
Let’s convert yolo predictions to RTSD traffic signs and then to labels for our task.
predicted_labels = {}
for label in tqdm(os.listdir(label_path)):
    predicted_labels[label[:-3]+'jpg'] = rtsd2predict(parse_labeltxt(os.path.join(label_path, label)))
Last step
Our solution file should not contain file names, but their id, which we can get from test.csv. We also take into account that we can have a maximum of 8 traffic signs, that is, our array with the prediction of traffic signs must be supplemented with zeros so that its length becomes 8.
img2id = {}
for index, row in test_csv.iterrows():
    img2id[row['img']] = row['id']

for img in predicted_final.keys():
    img_id = img2id[img]
    signs = predicted_final[img] + ((8-len(predicted_final[img]))*[0])
    sample_solution[sample_solution['id']==img_id] = [img_id] + signs

sample_solution.to_csv('solution.csv', index=False)
Ideas for improving the solution
Label the data from the training set for those traffic signs that are not in RTSD. This method definitely gives you +0.04-0.1 speed.
If you take a look at the training dataset and its labeling, it becomes obvious that sometimes you need to leave traffic signs that are far away, and sometimes not. It is possible that there is some correlation with which location is used. That is, it makes sense to experiment with confidence, as well as visualize the entire data set in order to understand in which cases errors were made in the markup.
It makes sense to solve this problem from the end. You need to understand how well the test data is marked up. Manually mark up all test images, and then send packages, which will allow us to find out what the system expects to receive from us. Thus, we can “fit” our solution to the answer.
Results
The problem itself is quite interesting, but the volume and quality of the markup makes it pointless to try to improve the solution. In my opinion, this approach to solving the problem is a challenge for the organizer of the competition. I hope that this will encourage them to think through their cases in more detail. The implementation of this solution took the author less than one day, but even this approach allows you to get into the top 5 of the leaderboard. I would like to believe that this article will be useful to all those who are just starting their competitive path.
Participate and win, good luck to everyone at the championships and hackathons!
All code is available in Github.
