Active competition for RAM in Android

Having developed a tool for visualizing RAM and zRAM in Android, I found that there is a lot of competition for resources in phones. And if the process needs resources that are already occupied by someone else, it will take them away, which can lead to critical situations and equipment conflicts.
Have you ever used utilities like htop, top, vmstat? If you have Linux installed at all, then most likely yes. And they show really good statistics on resource usage in the OS. I researched operating systems, and I lacked an understanding of what the physical address space really looks like: which specific addresses are occupied, which ones are free, what happens if processes request the same addresses, how often it happens.
It has been hypothesized that in Android (and Linux), there is intense competition for resources. Spoiler from the title of the article: it was confirmed.
I have developed an application that visualizes the allocation of processes in memory on Android phones. Data is read for each page of memory for the selected process. This data can also be further processed. The developed tool allows the user to explore both RAM and ZRAM, display the information received in a graphical form. The user can select processes from the cgroups tree.
The main application window looks like this. Next, we will consider exactly the memory card, which is displayed in the center.

A bit of theory
Memory management in Android is part of the Linux kernel functionality. The kernel has full access to system memory and allows processes to safely access that memory as needed. Applications are resource intensive and therefore diagnostics, analysis, and debugging are used to optimally allocate resources for applications. Understanding the dynamics of memory reallocation can provide a much clearer picture of the system. Meanwhile, mobile operating systems have more hardware and software limitations than desktop operating systems.
Memory management in Android OS is organized using 4K pages. The kernel keeps track of the state of every page of physical memory represented on the system.
I researched memory management techniques in Android and Linux and compared the tools available for checking and monitoring memory. There are no tools to visualize the picture. It is also difficult to interpret the numbers, so I introduced a high-quality indicator and displayed the memory card page by page.
apagescan collects information about the allocation of memory between multiple processes, then takes snapshots of memory and captures dynamic memory changes. apagescan works with procFS to read any number of pages in RAM, providing information about each page, including the present / swapped / dirty and anon / not anon flags.
Each page can be in one of the following states:
Present / not Present: The current page is mapped to a page in physical memory. If the page is not present, it can be swapped (moved) to disk.
Dirty / Clean: Dirty pages are pages that have changed because they have been paged into physical memory from disk memory and are waiting to be written back to disk. Clean pages are pages that have not been modified by the process.
Named / Anonymous: Named blank pages can be restored from a special file. Anonymous pages are supported by swap or physical memory. Anonymous blank pages can be restored from / dev / zero.
Also, users can select processes from cgroups to check. cgroups is a mechanism for grouping processes at the kernel level.
Received memory snapshots
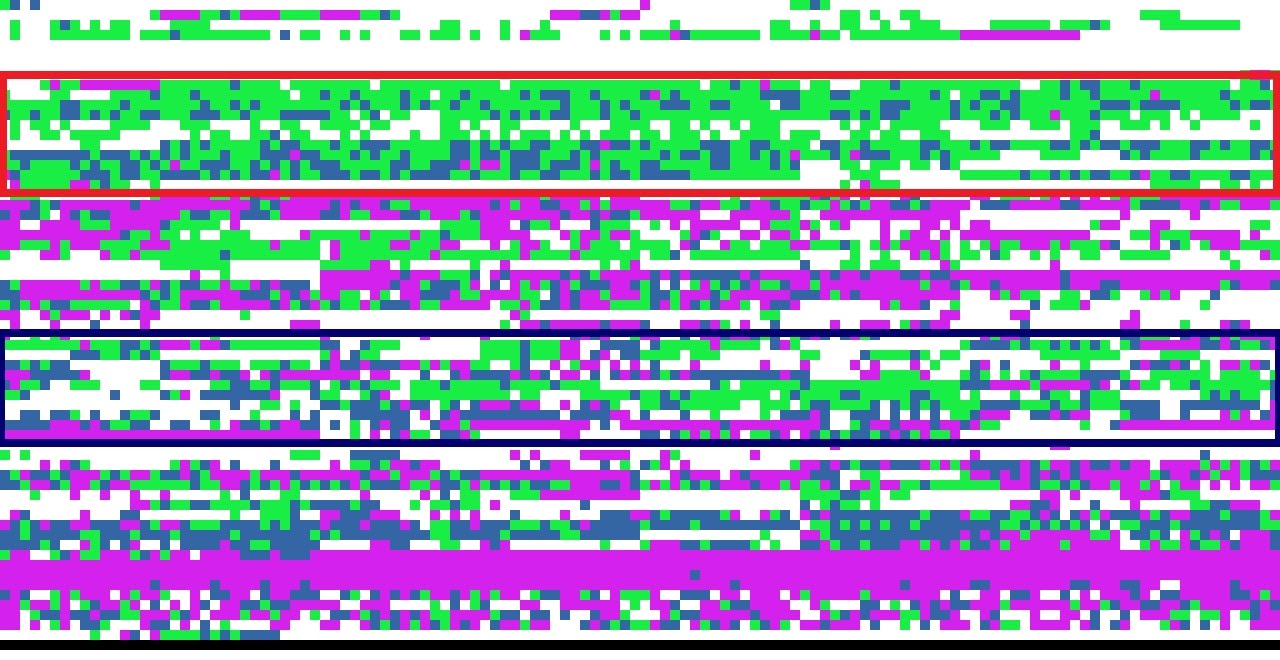
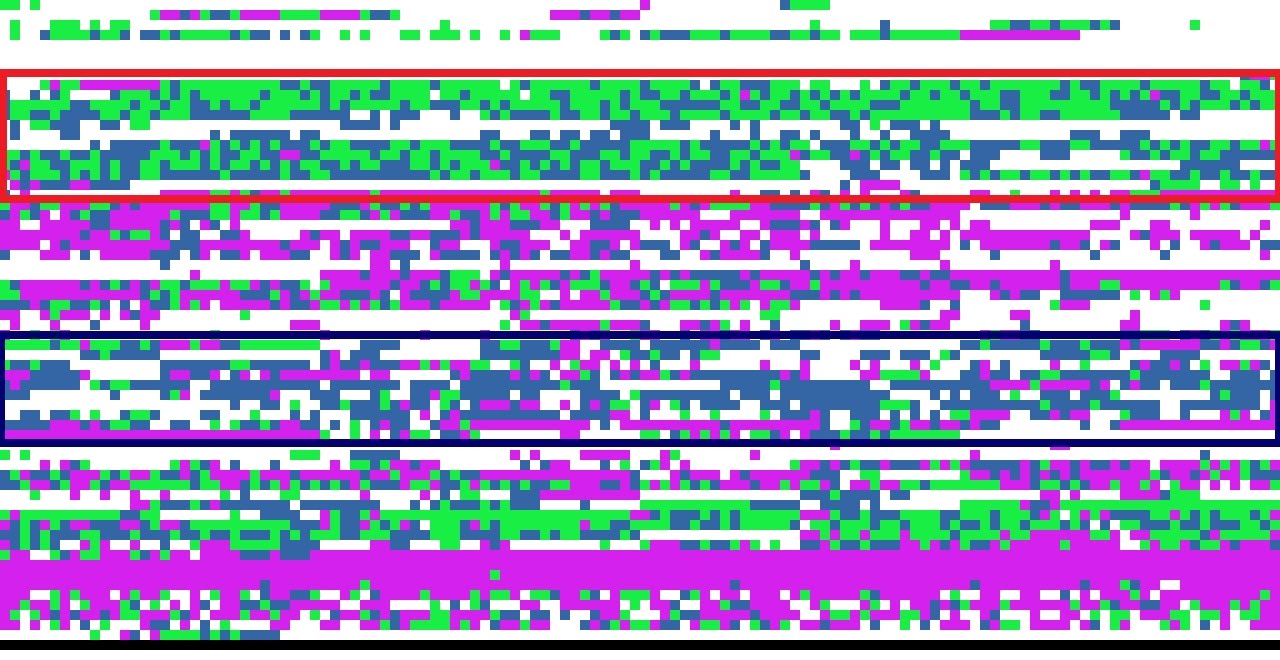
Three applications were launched on the Nexus 5, which were used for a total of two minutes, while apagescan was collecting data with a delay of 0 sec. between measurements. 60 snapshots of physical memory were taken. Each square (dot) in the picture is a page in the phone’s memory. The swap partition is separated by a bold black line at the bottom of the figures.
The experiment used camera applications (blue – 5837 PID), browser (fuchsia – 5307 PID), and gallery (green – 5390 PID). In fig. Below is the initial state of memory when the browser application was in use and other applications were in the background. Most of the RAM is occupied by the browser and much less by the camera and gallery. There are also no pages in the swap area.

There were some memory mapping changes while the browser was running, but they only became noticeable when the browser app went into the background and the camera app was selected (see Figure 2). Some of the pages were replaced by the camera pages, but most of them stayed where they were, and the camera pages just took up empty space.

In fig. 3-4 shows the “contention” between camera and gallery applications (red area) and the process of page preemption when the application goes into the background (blue area). That is, the figures show how different applications access the same memory areas (points on the graphs overlap each other). And testing various applications allowed me to see that the competition for resources occurs quite often. Especially if there are not very many resources, which, of course, is true for mobile phones.


conclusions
Knowing about the active memory contention in Android can come in handy both in the development of mobile applications and in areas related to resource scheduling in Android (and Linux). When one process requests resources that are already occupied by someone else, the first one will simply select them. This can lead to endless context switches during resource constraints, as well as critical situations and hardware conflicts. At the same time, identifying how applications are competing for resources allows you to optimize the entire system.


