28 Attributes of a Good PCB Block Diagram
In this text he wrote about a forgotten concept: block diagrams for electronics development. In GOST (e) they were called E1 (structural diagram). Block diagrams are a good level of abstraction when analyzing an electronic device or PCB. Introduced several attributes that were formed during the creation of flowcharts. He gave examples of exemplary block diagrams.
As a university lecturer often said: “Engineers are about circuits.” There is also a great English proverb: “A picture is worth a thousand words.”
Why is it important to create a block diagram?
1> To bring new people up to speed quickly.
2> To see potential design errors in the early phase of product development.
3> Flowcharts are, as the old American folk saying goes, “helicopter view”. Looking at the schematic, you can see the architecture of the board from a bird’s eye view.
3> To make it easier to navigate complex circuitry (E3)
I had an electrical diagram (E3) on 101 pages. E3 for 30-42 pages is generally the norm. It is necessary, for example, to understand what designator the JTAG connector has. Before looking for him in the electrical circuit, I will find his name from the block diagram in a couple of seconds. Then, with one search, I find a connector on a 70-page E3 named designator (a). Easy
4> To determine what the hardware platform of the product is generally capable of.
The block diagram immediately shows what sensors, interfaces, how much memory, what processors and what actuators are. All this is clear just by viewing the block diagram diagonally.
5> block diagram will allow you to verify the circuit diagram.
Simply put, if E3 cannot be compiled in any way E1 (E3 does not indicate where some wires go), then E3 should be sent for revision.
6> The block diagram will help you compose the firmware. It is immediately clear which components need to be connected to the assembly by looking at the block diagram. As a university professor used to say: “Hardware comes first Software comes second”.
7> The block diagram will help integrators to install the device. It will help them find the right connector and they will understand which side to approach the board from. And it’s all thanks to the block diagram.
Why not enough electrical circuit diagram?
The main problem of electrical circuit diagrams (E3) is “flying fragments”.

You need to constantly use the search to track where a particular wire goes (for example, 3V3 or VBUS). It’s good when E3 is in *.pdf. However, often in post-Soviet companies in terms of mentality, E3 electrical circuit diagrams are still distributed within the organization in the form of a photograph (*.JPG file or even *.PNG or *.TIF) and naturally there is no search there. Therefore, it is highly desirable to make PCB block diagrams.
How to create, edit and distribute flowcharts?
Vector graphics and *.svg files are ideal for flowcharts. There is a free and powerful program inkscape. Inkscape is an editor for vector graphics and *.svg files. Like paint only for vector graphics, not bitmap. Unlike the notorious draw.io (where you need to log in for some reason), Inkscape takes 2 minutes. Inkscape has layers. You can reduce the complexity of circuits by turning off, for example, the power distribution layer and consider only System design. Inkscape has a lot of intuitive tools and no authorization. Also Inkscape wins over MS Visio as Inkscape is free.
It is clear that the block diagram should be viewed on a monitor in special software with layers and with an increase in the necessary places from a *.pdf or *.svg file through an editor / browser. A distinctive feature of vector graphics is that the image quality does not deteriorate when the image is enlarged, as it is everywhere in raster graphics (photos). It is very rare that flowcharts need to be printed on paper as they are very informative.
All well-known vendors provide high-quality and detailed block diagrams of their products. Leading the way in providing high quality block diagrams is of course STMicroelectronics. Their block diagrams of SoC(s) are amazing.
Attributes of a good block diagram for PCB:
Followed by manual for block diagramming. The rules were formed as usual from real incidents when creating flowcharts.
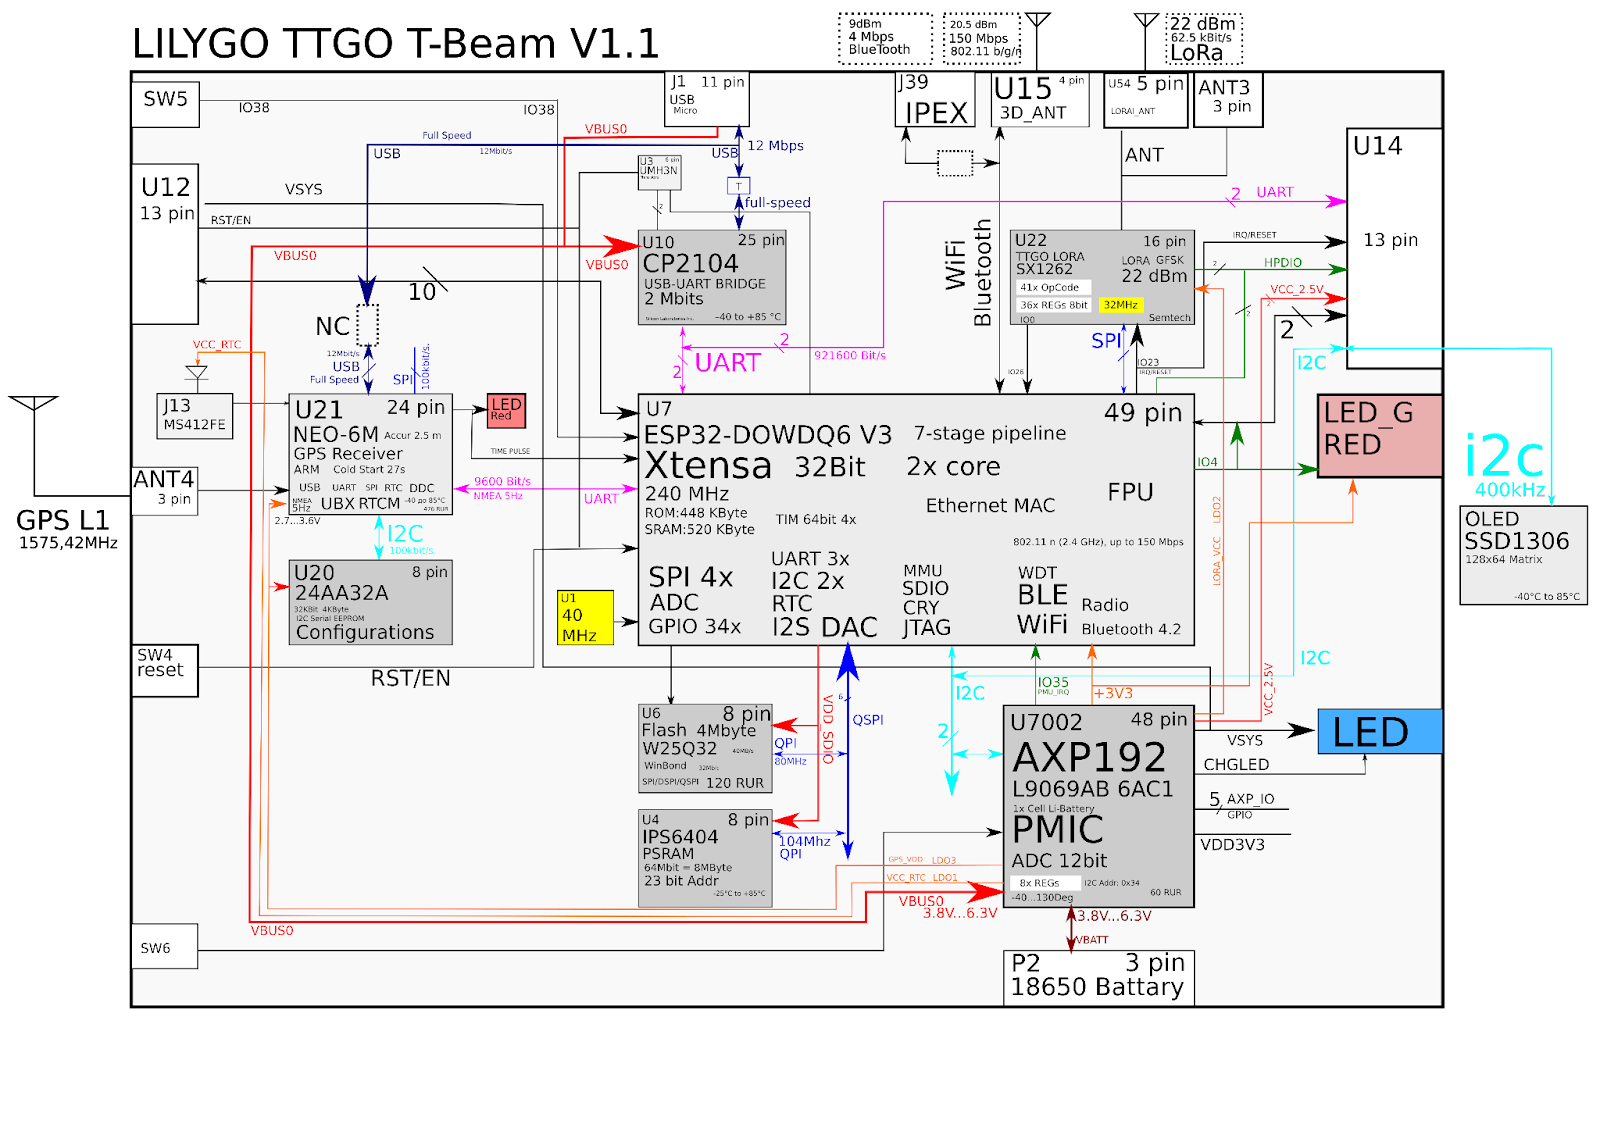
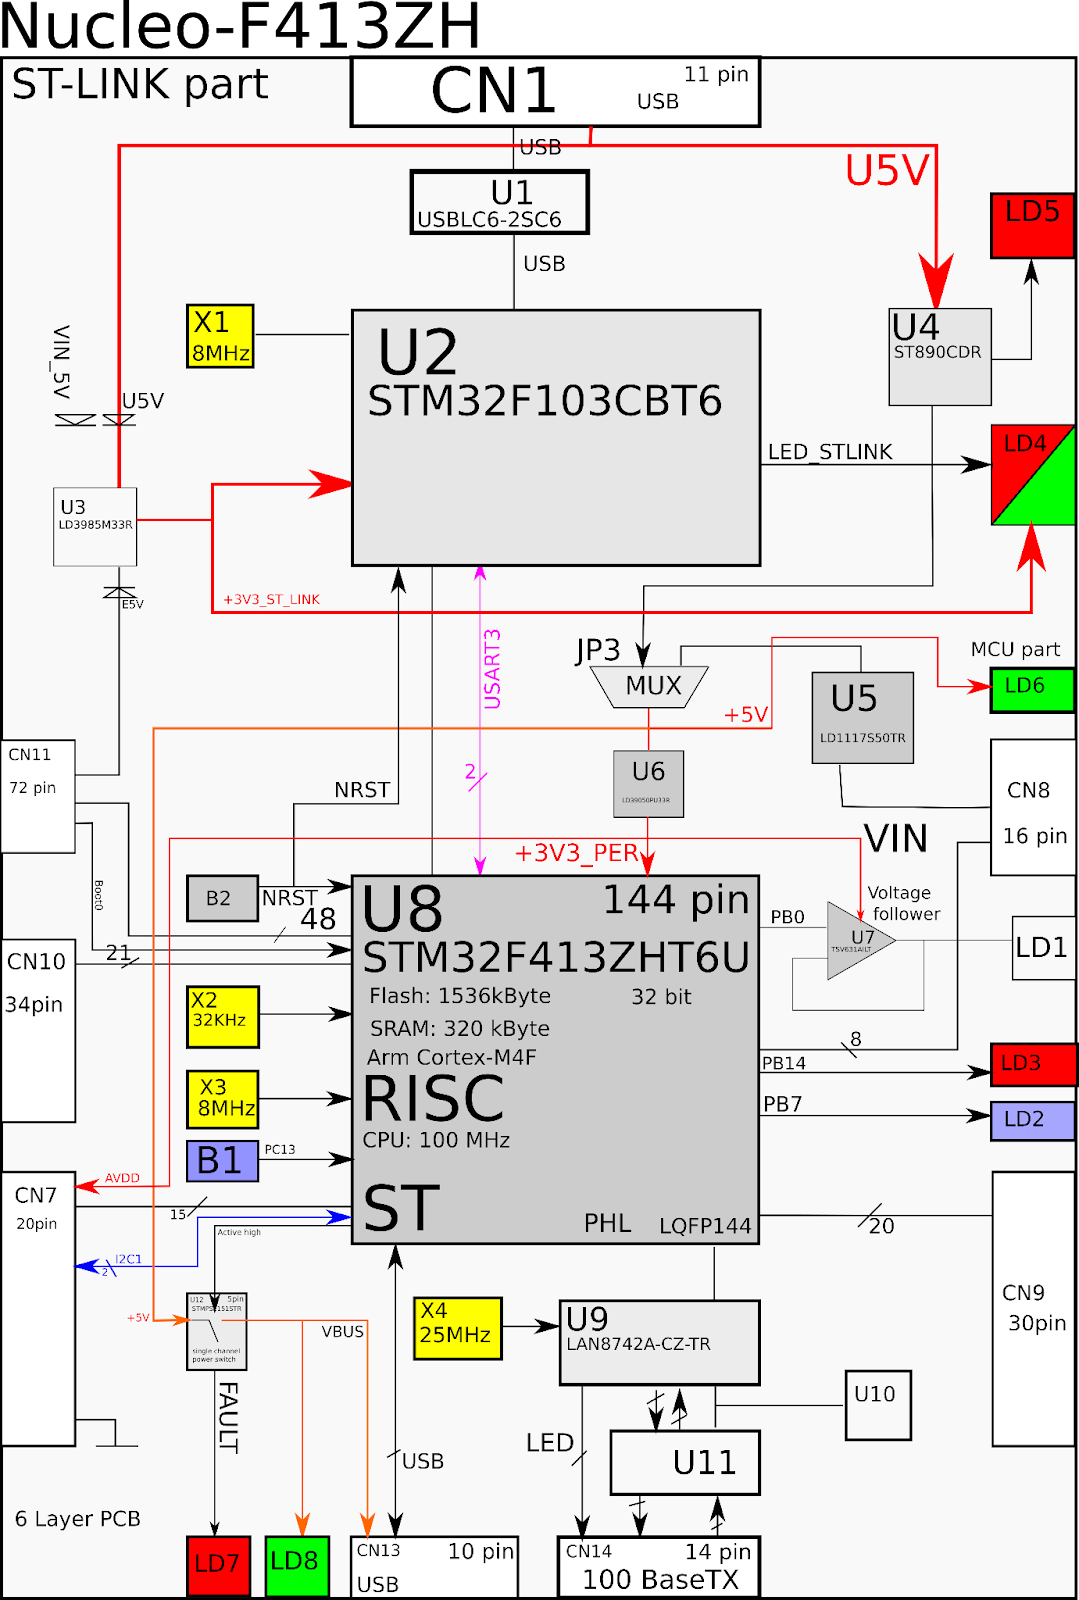
1) Block diagram should fit on one sheet. This is her meaning. Minimum area, maximum information.
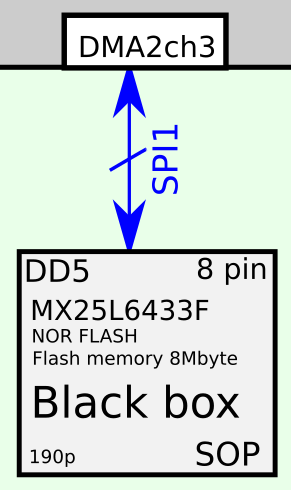
2–Show continuous arrows where the data goes.
3–use various colors to refer to different data rails and voltage rails.
4–Show bit depth Data buses: UART, SPI, I2S, I2C, PCI, VR12, SDIO, SWD, CAN, MII, MDIO, USB, 100BaseT1, SpaceWire, etc.
5–Show how many pin(s) on each chip and connector (and how many free Pin(s))
This will allow you to find a match between the schematic and the actual physical device when you bring-up(e) the product.
6 – Show quartz resonators / generators in yellow and indicate what frequencies chips are clocked.

7–Show titles interfaces: I2C, MDIO, SPI, JTAG and their maximum bit rates in this device.
8–Show above interfaces that work in both directions CAN, RS232, 100BaseTX, 100BaseT1.
nine-Bottom show memory PCB.
ten-Left show dividers voltage (specify division factor)
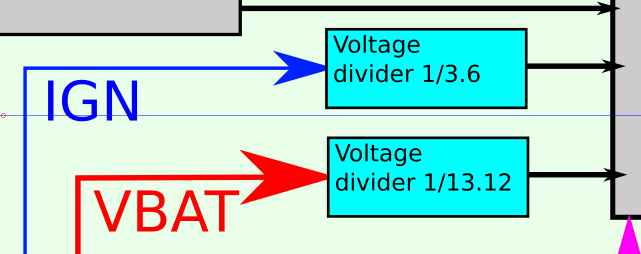
11–Show how tension each chip is powered
12 – Show in green analog filters

13-If the microcircuit has internal registers, then indicate amount registers and them bit depth. This will allow you to estimate the labor costs for writing a driver for this smart fancy chip.

14–sign name major wires
15–What on the entrance devices: crystal oscillators, sensors, pushbuttons left.
16 – What’s on outlet devices: LEDs, screens, DACs, relays, motors, audio codecs. reflect in right parts of the schema.

to a person naturally analyze information for from left to right and top down. The author of the flowchart should keep this in mind.
17 – along the edges of connectors and interfaces
18 color to show which chip is in which layer.
19–Reflect descriptors microchips U1…Un
20–Reflect descriptors connectors (X1…Xn) and
21–Reflect titles microcircuits and their appointment
22– Reflect theoretical and practical value consumed power. It is possible to detect a short circuit if the actual power value exceeds the theoretical value from the block diagram.
23–Show arrows as it spreads nutrition on board.
Additional Block Diagram Attributes
24-show price each chip
25-show quantity layers PCB
26–show bit depth DAC/ADC chips
27–show type corps each chip
28-show temperature chip range
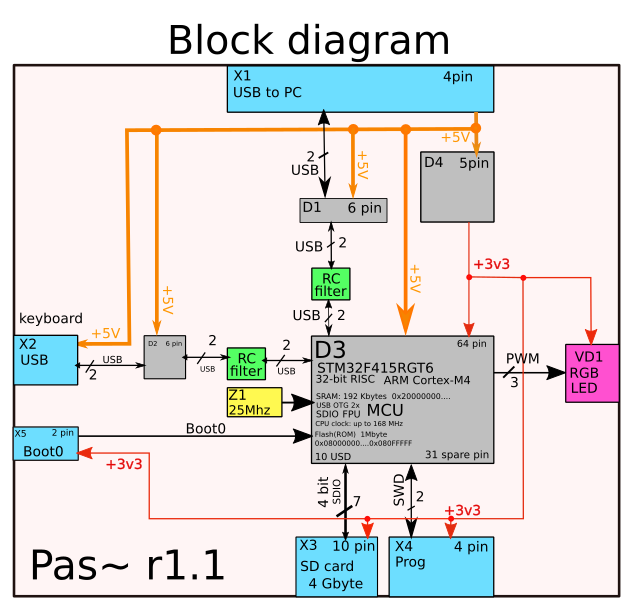
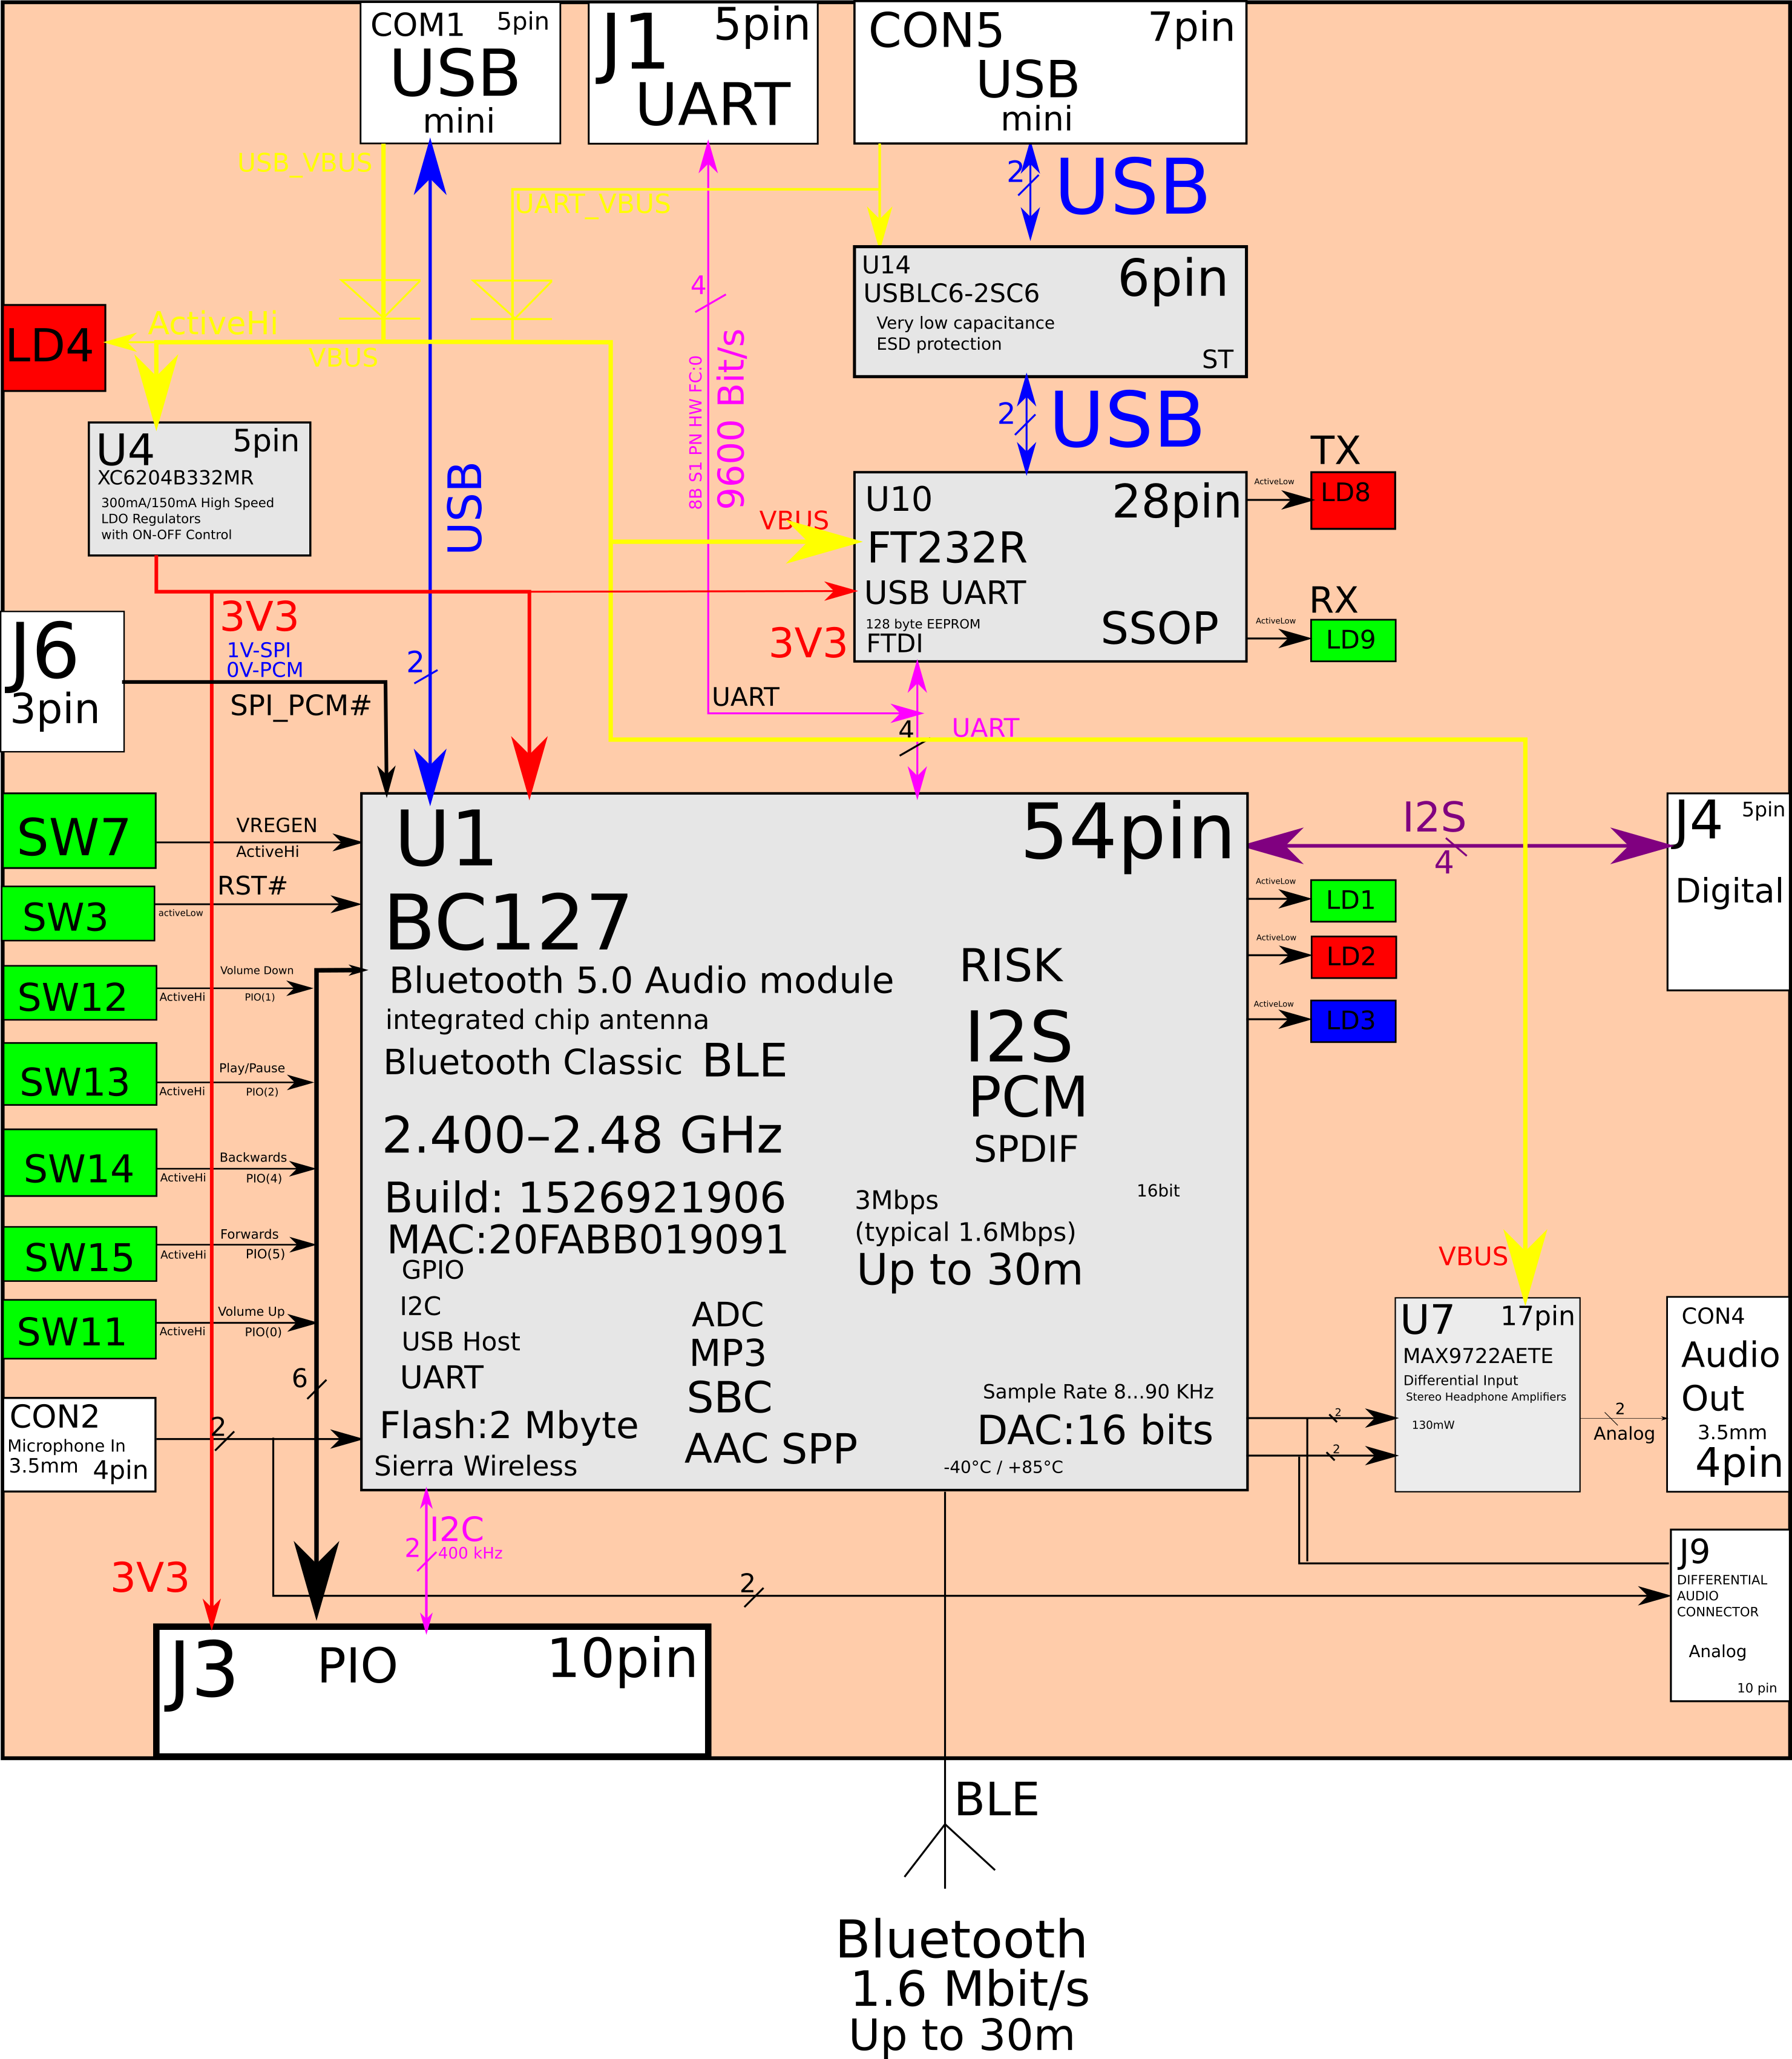
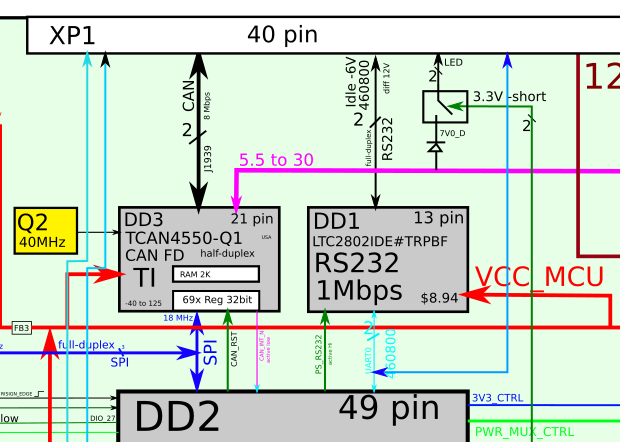
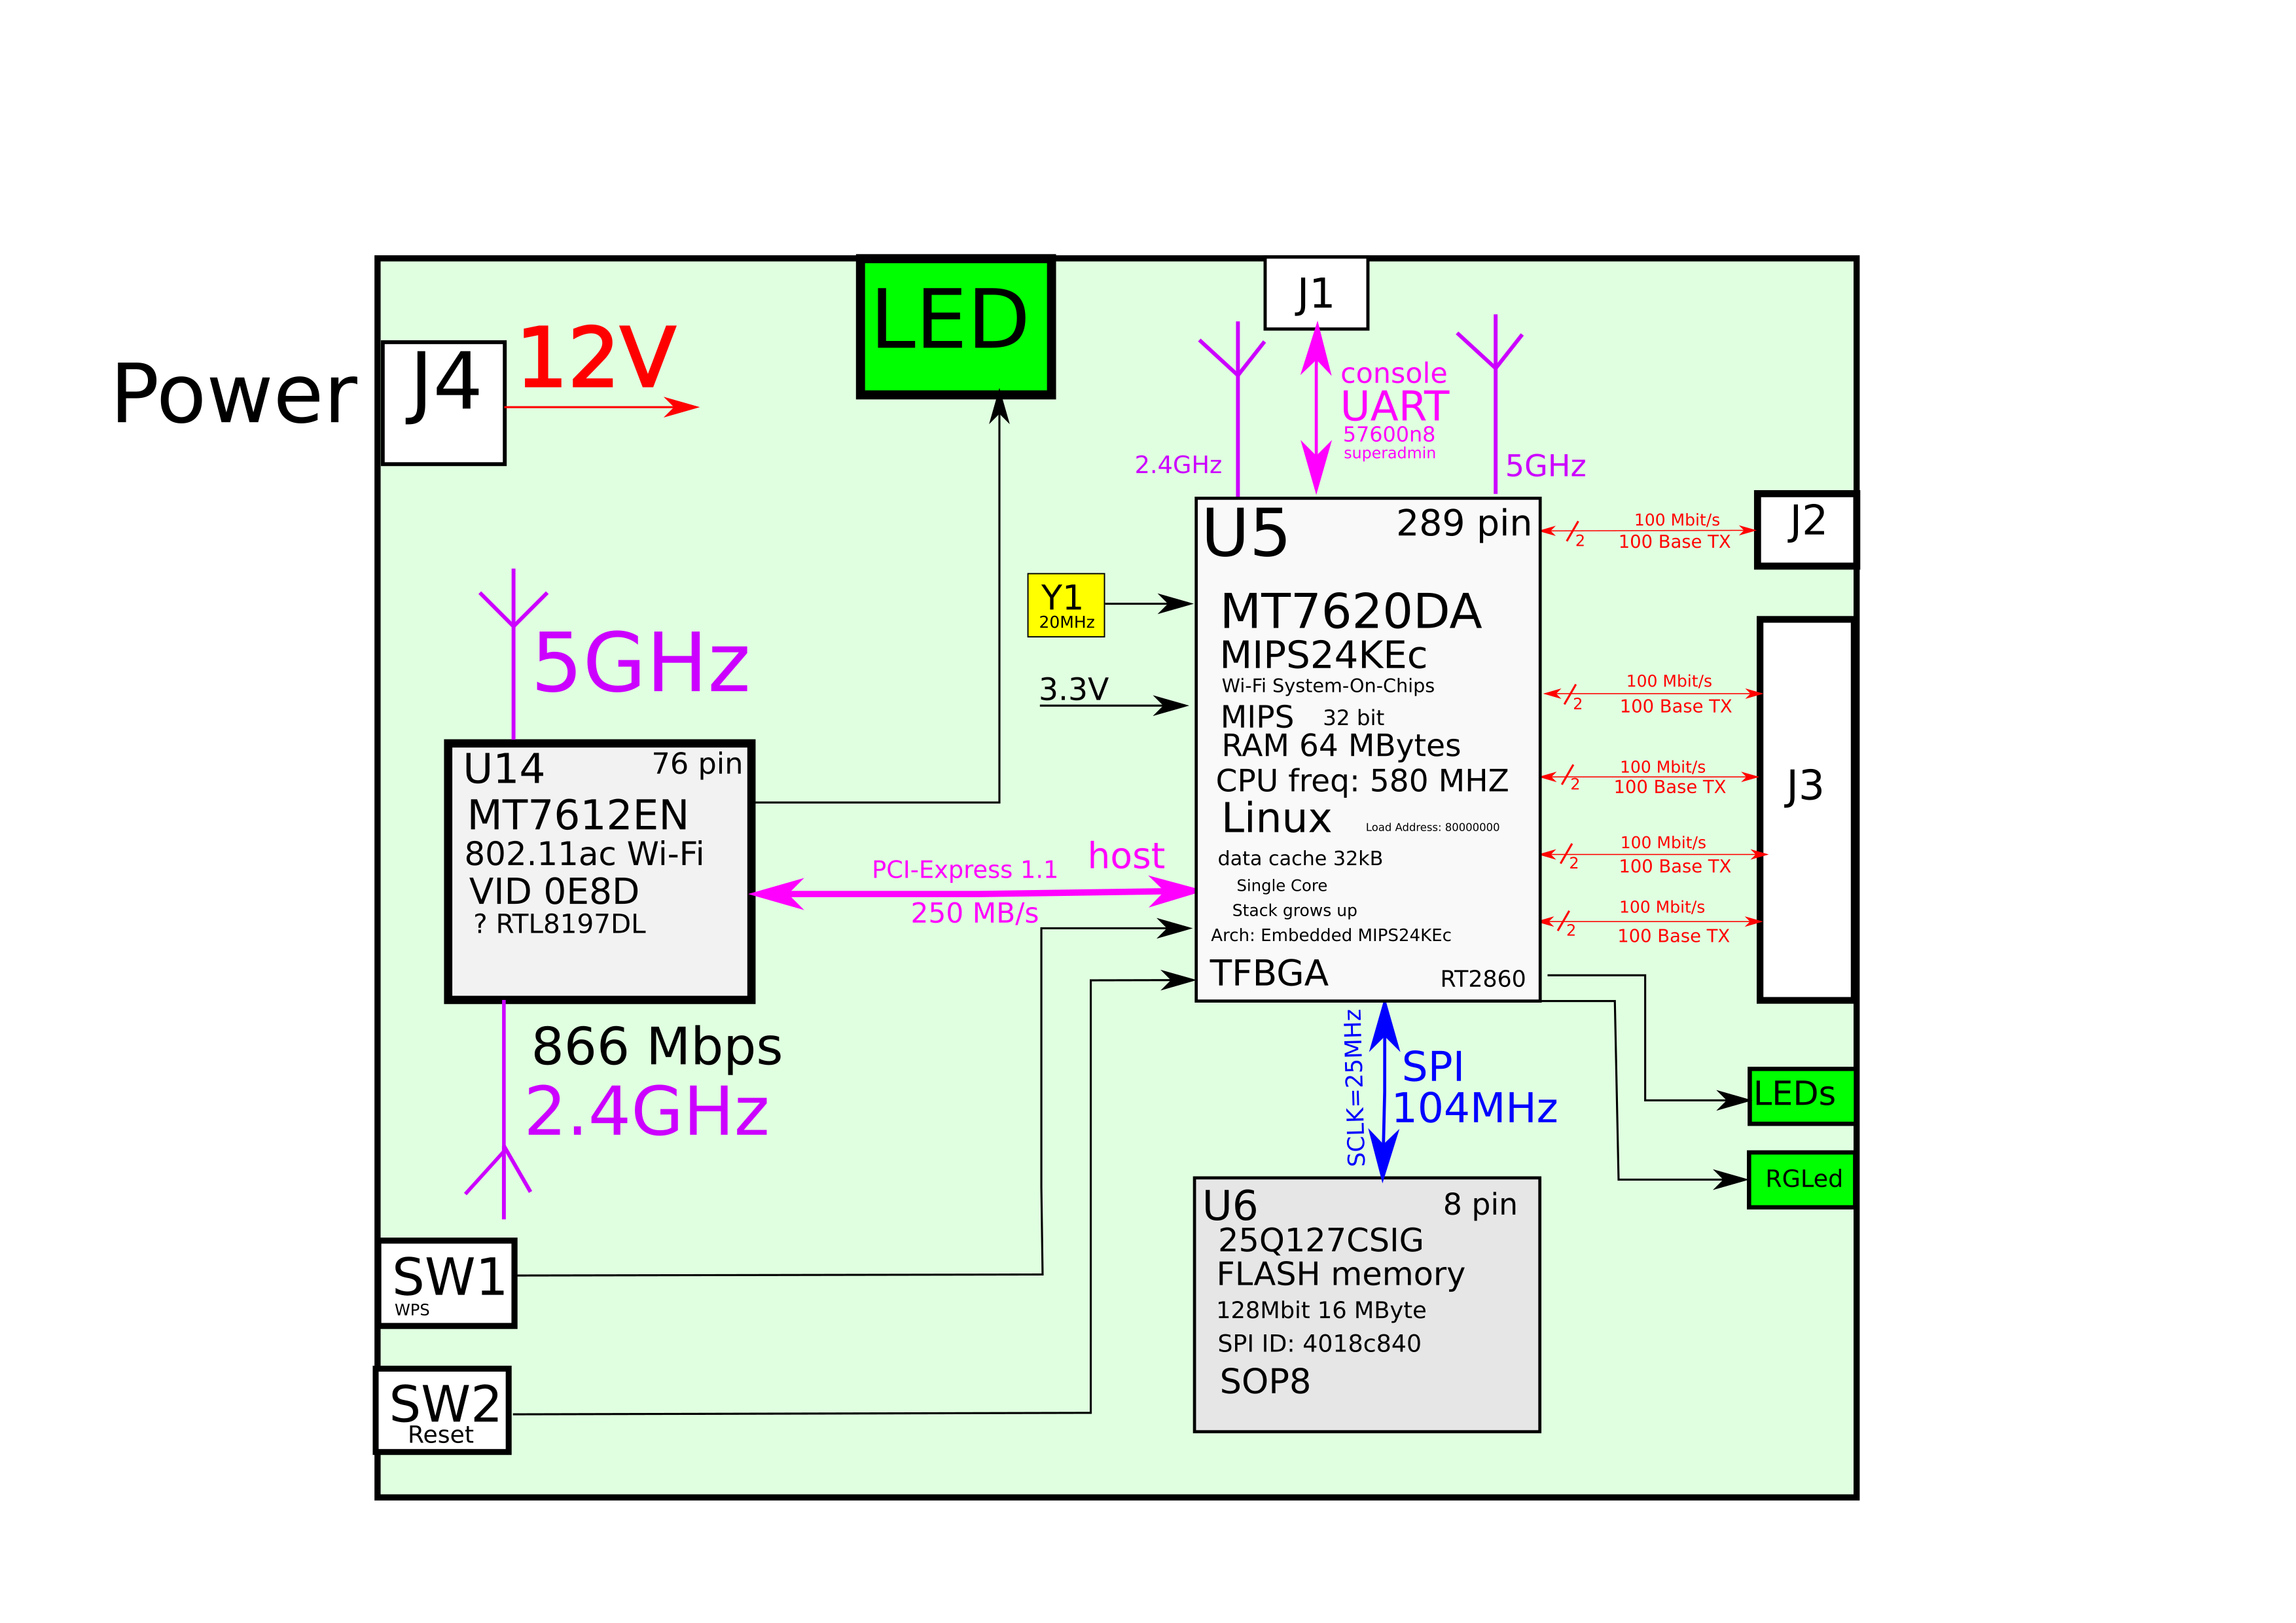
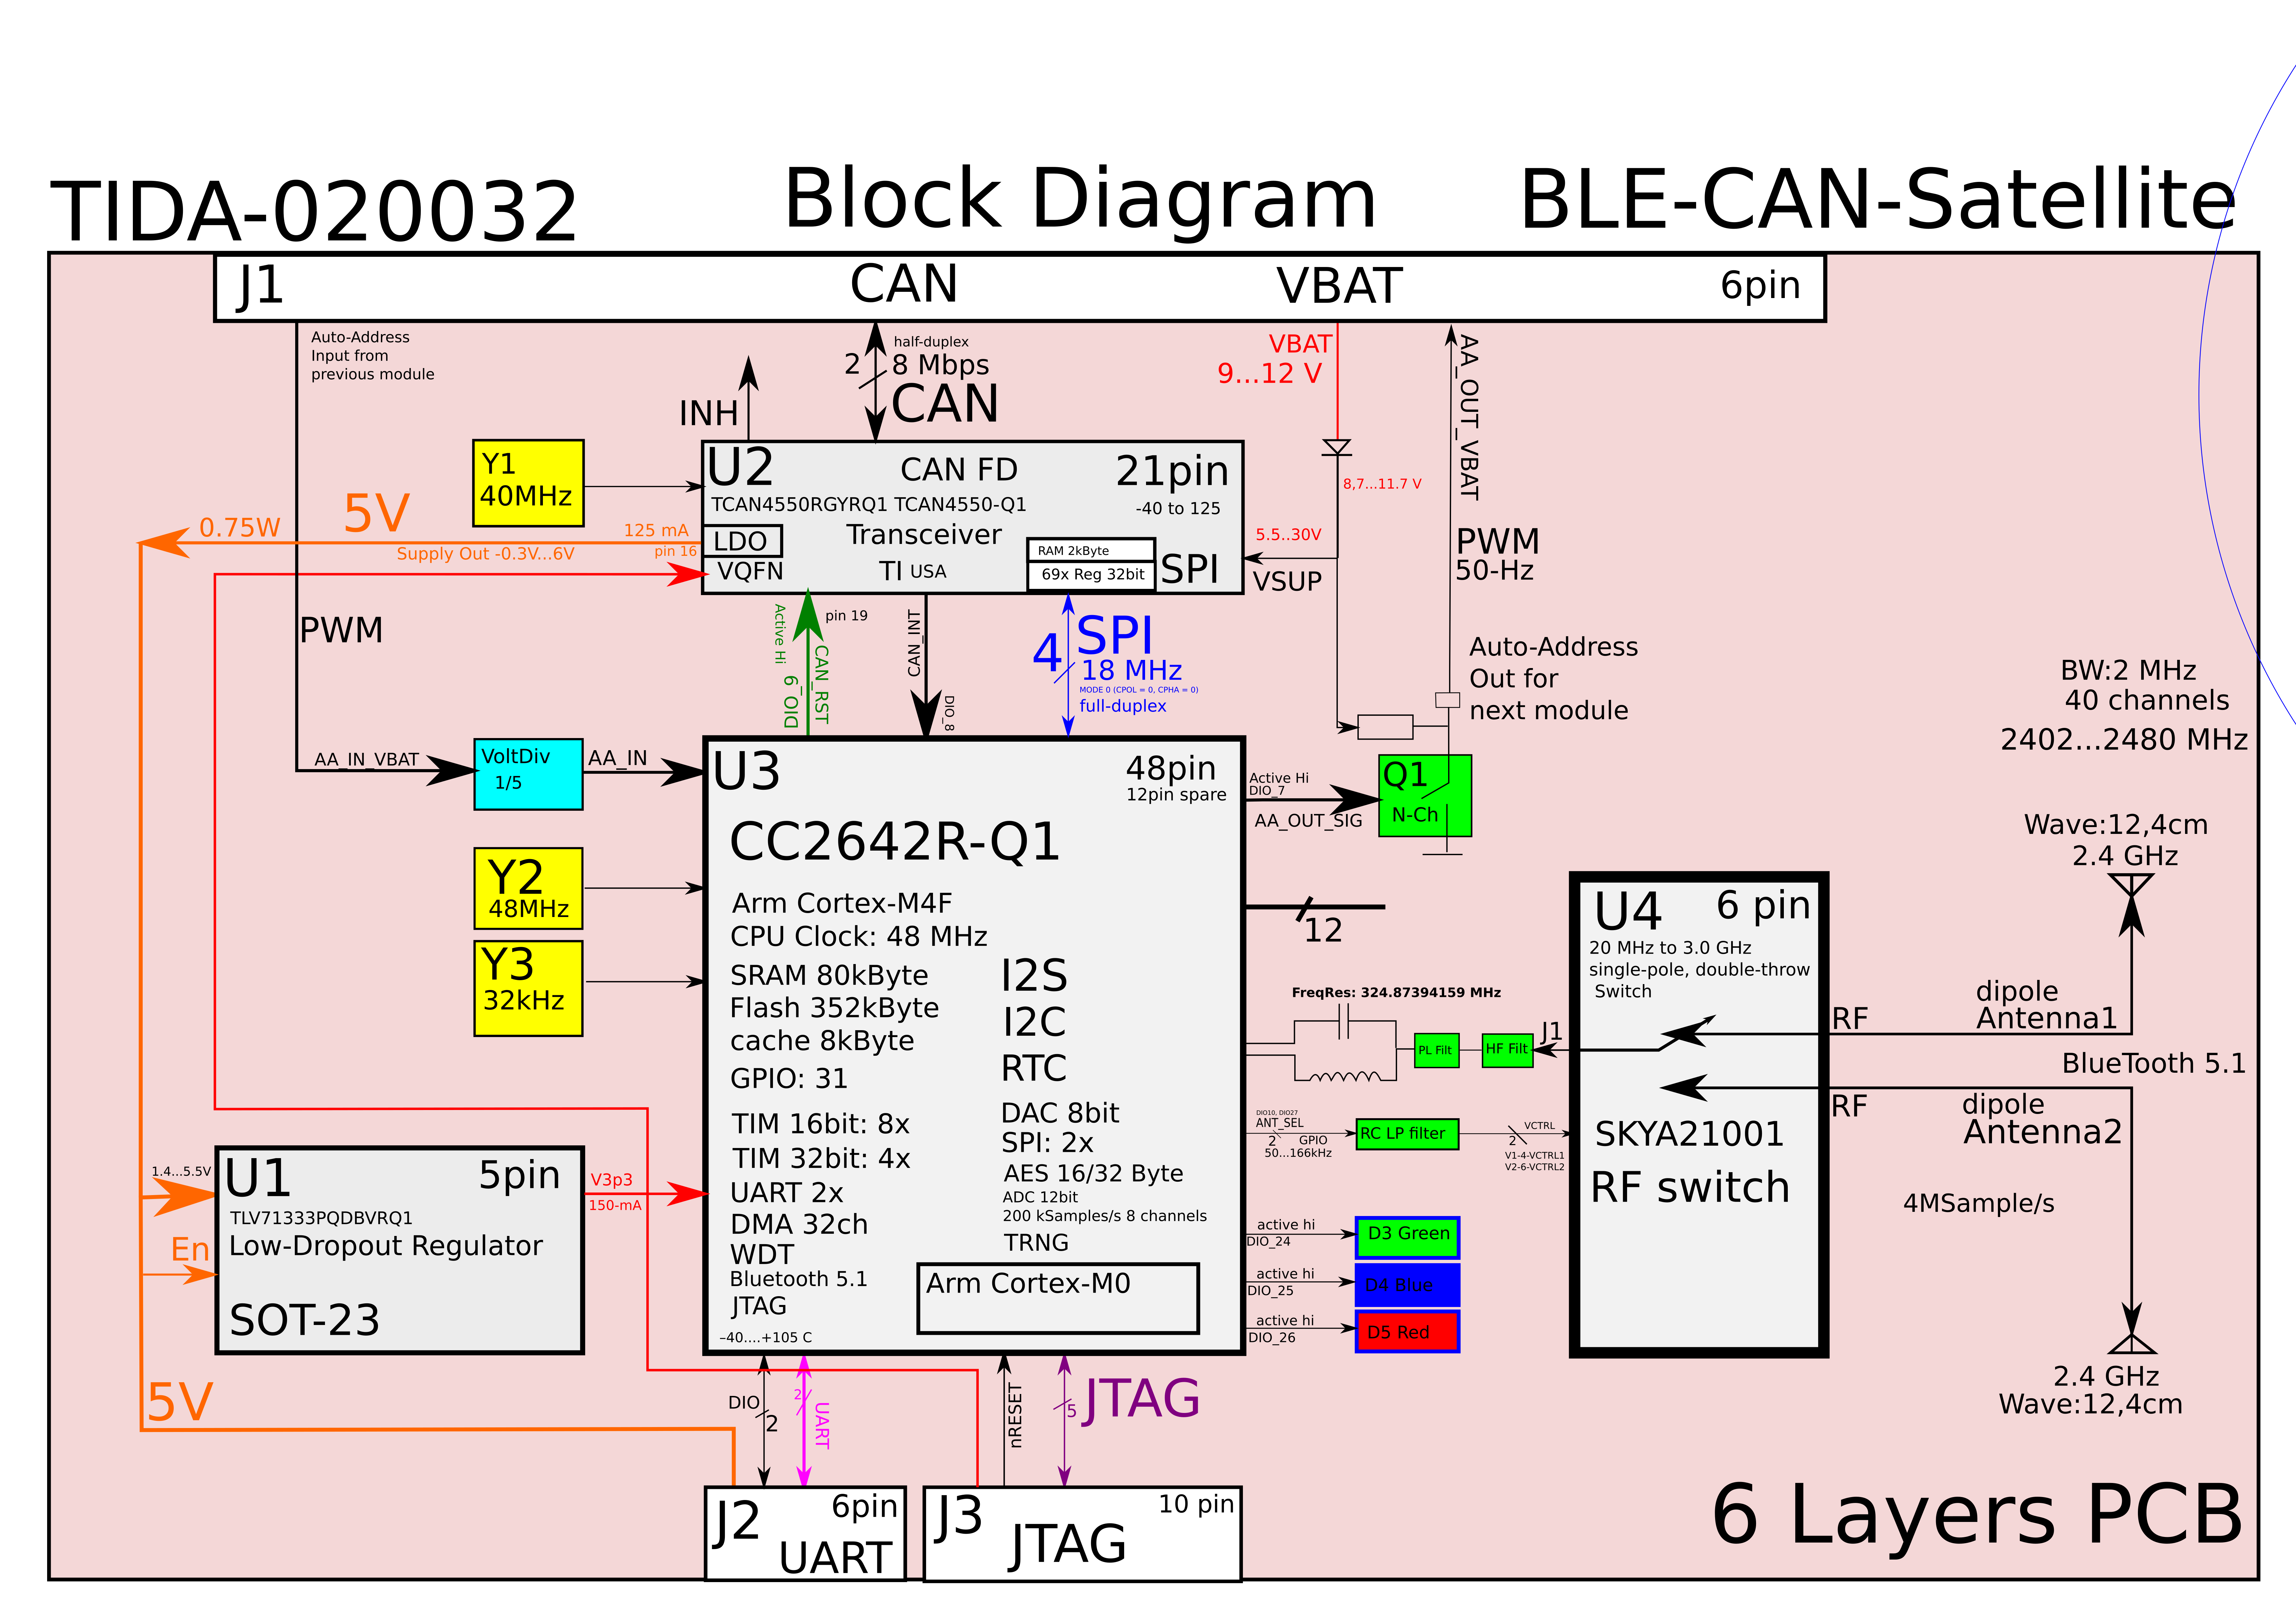
Showroom block diagram
Conclusion:
Block diagrams are a powerful tool for visualizing the architecture of an electronic product. There is a software tool Inkscape and a special *.svg file format for editing vector graphics and creating high-quality flowcharts.
Links to related articles
— Electrical diagrams. Schema types: https://habr.com/ru/post/451158/
–Dragon Schema https://habr.com/en/post/541478/
–Inkscape: start: https://habr.com/en/post/317172/
If you have comments on what else should be indicated on the flowcharts or how to create them at all, then indicate this in the comments.