1. FortiAnalyzer Getting Started v6.4. Introduction
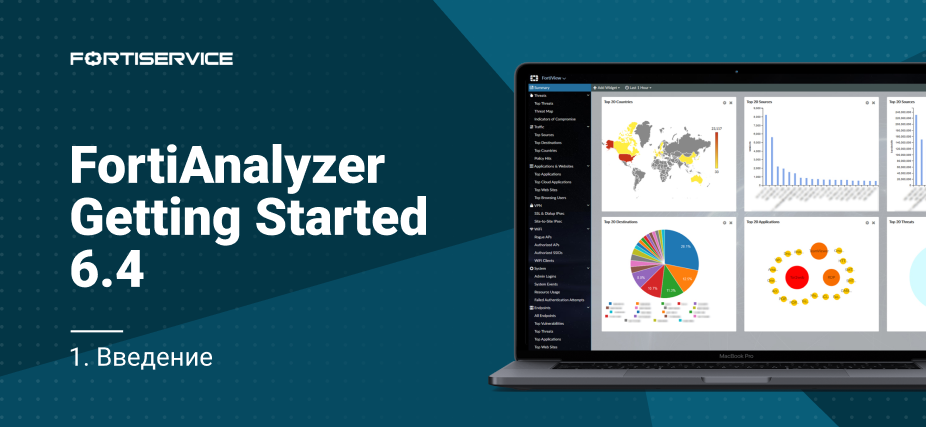
Hello, friends! We are delighted to welcome you to our new FortiAnalyzer Getting Started course. In the Fortinet Getting Started course, we already looked at the functionality of FortiAnalyzer, but went through it rather superficially. Now I want to tell you in more detail about this product, about its goals, objectives and capabilities. This course should not be as extensive as the last one, but I hope it will be interesting and informative.
Since the lesson turned out to be completely theoretical, for your convenience we decided to present it also in the format of an article.
During this course, we will cover the following points:
- General information about the product, its purpose, tasks and key features
- Let’s prepare the layout, during preparation we will take a closer look at the initial configuration of FortiAnalyzer
- Let’s get acquainted with the mechanism for storing, processing and filtering logs for their convenient search, as well as consider the FortiView mechanism, which presents visual information about the state of the network in the form of various graphs, charts and other widgets
- Consider the process of creating existing reports, as well as learn how to create your own reports and edit existing reports
- Let’s go through the main issues related to the administration of FortiAnalyzer.
- Let’s discuss the licensing scheme again – I already talked about it in Lesson 11 of the Fortinet Getting Started course, but, as they say, repetition is the mother of the day.
The main purpose of FortiAnalyzer is centralized storage of logs from one or several Fortinet devices, as well as their processing and analysis. This allows security administrators to monitor various network and security events from one place, quickly obtain the necessary information from logs and widgets, as well as build reports on all devices or devices of interest.
The list of devices from which FortiAnalyzer can receive logs and analyze them is shown in the figure below.

FortiAnalyzer has three key features – reporting, alerts, archiving. Let’s consider each of them.
Reporting – Reports provide a visual representation of network events, security events, and various activities occurring on supported devices. The reporting engine collects the necessary data from the available logs and presents them in an easy-to-read and analyze form. Using reports, you can quickly get the information you need about device performance, network security, most visited resources, and more. There are a lot of options. You can also use reports to analyze the status of your network and supported devices over a long period of time. Quite often they are indispensable when investigating various security incidents.
Alerts allow you to quickly respond to various threats occurring on the network. The system generates alerts when logs appear that meet pre-configured conditions – virus detection, exploitation of various vulnerabilities, and so on. These notifications can be viewed in the FortiAnalyzer web interface, as well as configured to be sent via SNMP protocol to the syslog server, as well as to specific email addresses.
Archiving allows FortiAnalyzer to store copies of various content passing over the network. This is usually used in conjunction with the DLP engine to store various files that fall under the different rules of the DLP engine. It can also be useful for investigating various security incidents.
Another interesting feature is the ability to use administrative domains. This technology allows you to create groups of devices based on various criteria – device types, geographic location, and so on. The creation of such device groups has the following goals:
- Grouping devices based on similar features for ease of monitoring and management – let’s say devices are grouped by geographic location. You need to find any information in the logs for devices in the same group. Instead of carefully filtering out the logs, you simply look at the logs for the required administrative domain and look for the necessary information.
- To delimit administrative access – each administrative domain can have one or more administrators who have access only to this administrative domain
- Effectively manage disk space and storage policies for device data – Rather than creating a single storage configuration for all devices, administrative domains allow more appropriate configurations for specific groups of devices. This can be useful if you have several devices, and you need to store data for one device group for a year, and for another – for 3 years. Accordingly, you can allocate suitable disk space for each group – more space can be allocated for a group generating a large number of logs, and less space for another group.
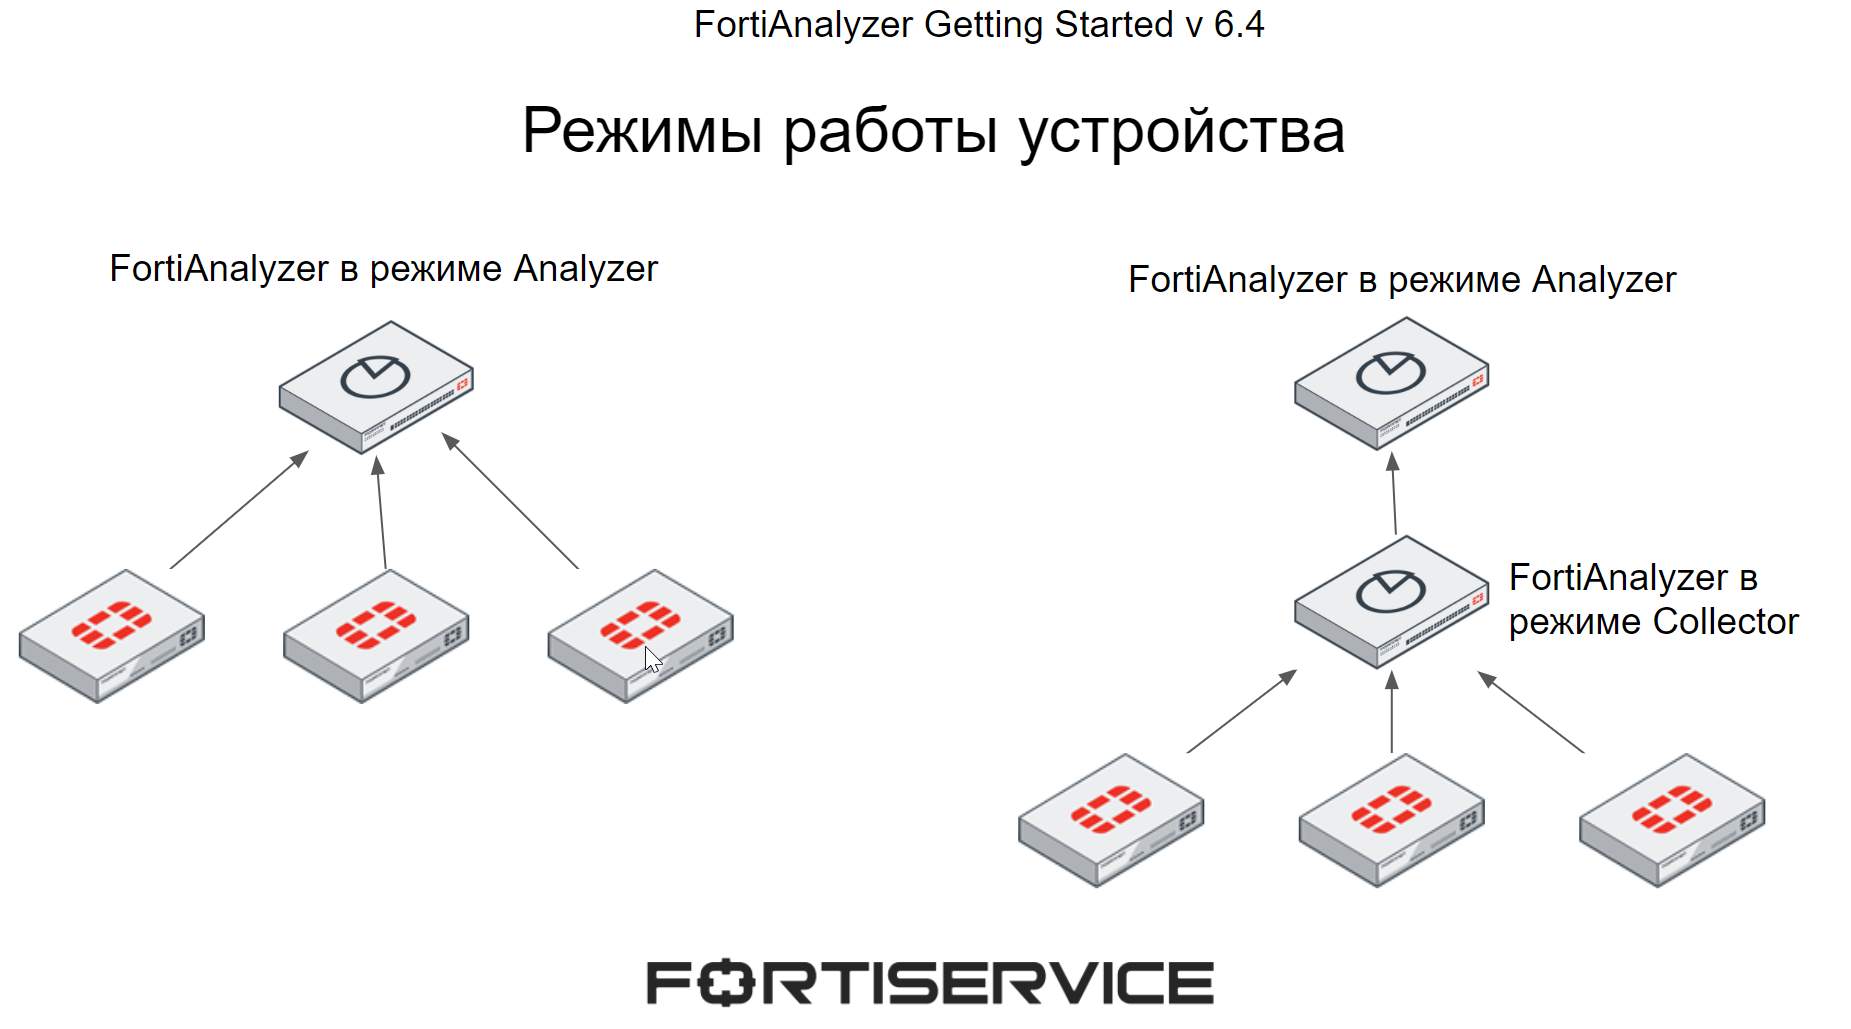
FortiAnalyzer can work in two modes – Analyzer and Collector. The operating mode is selected depending on individual requirements and network topology.
When FortiAnalyzer is running in Analyzer mode, it acts as the main log aggregator from one or more log collectors. The log collectors are both the FortiAnalyzer in Collector mode and other devices that are supported by FortiAnalyzer (they were listed above in the figure). This operating mode is used by default.
When the FortiAnalyzer is in Collector mode, it collects logs from other devices and then sends them to another device, such as the FortiAnalyzer in Analyzer or Syslog mode. In Collector mode, FortiAnalyzer cannot use most of the functions such as reporting and alerts, as its main purpose is to collect and forward logs.
Using several FortiAnalyzer devices in different modes can increase performance – FortiAnalyzer in Collector mode collects logs from all devices and sends them to the Analyzer for further analysis, which allows FortiAnalyzer in Analyzer mode to save resources spent on receiving logs from multiple devices and completely focus on processing logs.
FortiAnalyzer supports a declarative SQL query language for logging and reporting. With its help, logs are presented in a readable form. Various reports are also built using this query language. Some reporting capabilities require some knowledge of SQL and databases, but often the built-in capabilities of FortiAnalyzer make it possible to dispense with this knowledge. We’ll come across this when we look at the reporting mechanism.
FortiAnalyzer itself can be presented in several variants. It can be a separate physical device, a virtual machine – different hypervisors are supported, a full list of them can be found in datasheet… It can also be deployed in specialized infrastructures – AWS. Azure, Google Cloud and others. And the last option is FortiAnalyzer Cloud, a cloud service provided by Fortinet.
In the next lesson, we will prepare a layout for further practical work. In order not to miss it, subscribe to our Youtube channel…
You can also follow the updates on the following resources:
Vkontakte community
Yandex Zen
Our website
Telegram channel